C
Seller's Agent in 2015
Carina Martin
NOT A VALID MEMBER
Estimated Value: $475,000 - $479,000
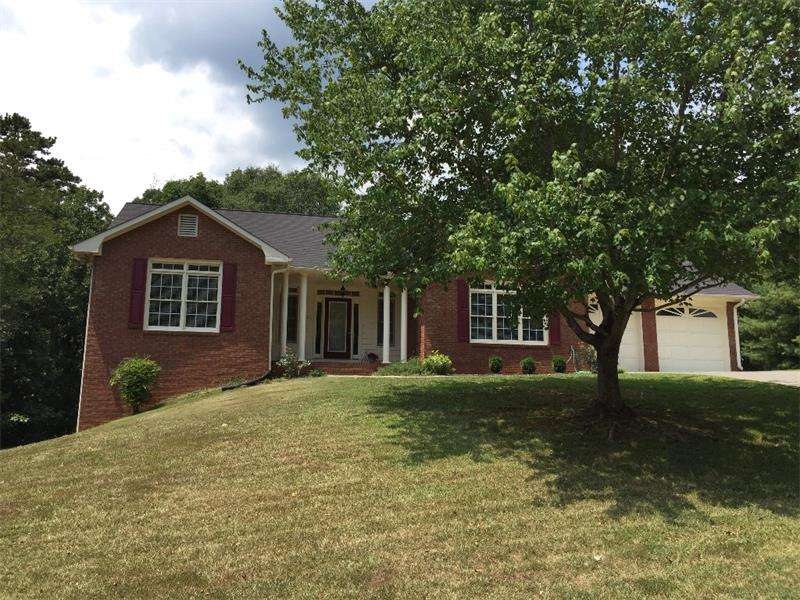
BEAUTIFUL 4 SIDED BRICK RANCH on a full basement, 3 bedroom 2 bath home with lots of room to grow, NEW CARPET throughout, NEW appliances in the eat-in kitchen, Formal dining room, UPDATED beautiful renovated bathroom, 2 HUGE backyards (one with RIVER access) perfect for activities and family gatherings. IDEAL home for the WATER lovers, ADVENTURE seekers and people that love NATURE! Home is well maintained and ready for move in!
Last Agent to Sell the Property
Carina Martin
NOT A VALID MEMBER License #295859 Listed on: 08/14/2015
Last Buyer's Agent
Vivian Nystrom
NOT A VALID MEMBER License #175211

We collect this data history from publicly available records. To have your information removed, we recommend requesting removal directly through your county’s website.
We collect this data history from publicly available records. To have your information removed, we recommend requesting removal directly through your county’s website.
| Date | Buyer | Sale Price | Title Company |
|---|---|---|---|
| $220,000 | -- |
We collect this data history from publicly available records. To have your information removed, we recommend requesting removal directly through your county’s website.
| Date | Event | Price | List to Sale | Price per Sq Ft |
|---|---|---|---|---|
| 12/11/2015 12/11/15 | Sold | $220,000 | -4.3% | -- |
| 11/07/2015 11/07/15 | Pending | -- | -- | -- |
| 09/14/2015 09/14/15 | Price Changed | $229,900 | -4.2% | -- |
| 08/14/2015 08/14/15 | For Sale | $239,900 | -- | -- |
We collect this data history from publicly available records. To have your information removed, we recommend requesting removal directly through your county’s website.
| Year | Tax Paid | Tax Assessment Tax Assessment Total Assessment is a certain percentage of the fair market value that is determined by local assessors to be the total taxable value of land and additions on the property. | Land | Improvement |
|---|---|---|---|---|
| 2025 | $4,070 | $174,640 | $55,000 | $119,640 |
| 2024 | $4,070 | $163,942 | $50,000 | $113,942 |
| 2023 | $4,145 | $150,027 | $50,000 | $100,027 |
| 2022 | $4,067 | $150,027 | $50,000 | $100,027 |
| 2021 | $3,029 | $115,852 | $40,000 | $75,852 |
| 2020 | $3,346 | $115,852 | $40,000 | $75,852 |
| 2019 | $2,886 | $98,796 | $30,000 | $68,796 |
| 2018 | $2,609 | $89,080 | $11,800 | $77,280 |
| 2017 | $2,463 | $89,080 | $11,800 | $77,280 |
| 2016 | $2,596 | $88,000 | $11,800 | $76,200 |
| 2015 | $1,388 | $74,840 | $10,160 | $64,680 |
| 2014 | $1,392 | $73,200 | $10,160 | $63,040 |
| 2013 | -- | $73,200 | $10,160 | $63,040 |
C
Seller's Agent in 2015
Carina Martin
NOT A VALID MEMBER
V
Buyer's Agent in 2015
Vivian Nystrom
NOT A VALID MEMBER
Source: First Multiple Listing Service (FMLS)
MLS Number: 5583177
APN: 0034H-0003-037
![]() Listings identified with the FMLS IDX logo come from FMLS and are held by brokerage firms other than the owner of this website. The listing brokerage is identified in any listing details. Information is deemed reliable but is not guaranteed. If you believe any FMLS listing contains material that infringes your copyrighted work please visit www.fmls.com/dmca to review our DMCA policy and learn how to submit a takedown request. © 2026 First Multiple Listing Service, Inc.
Listings identified with the FMLS IDX logo come from FMLS and are held by brokerage firms other than the owner of this website. The listing brokerage is identified in any listing details. Information is deemed reliable but is not guaranteed. If you believe any FMLS listing contains material that infringes your copyrighted work please visit www.fmls.com/dmca to review our DMCA policy and learn how to submit a takedown request. © 2026 First Multiple Listing Service, Inc.
Disclaimer: Certain information contained herein is derived from information provided by parties other than Homes.com. All information provided is deemed reliable, but is not guaranteed to be accurate and should be independently verified.
Ask me questions while you tour the home.