Estimated Value: $556,787 - $625,000
4
Beds
2
Baths
2,006
Sq Ft
$292/Sq Ft
Est. Value
About This Home
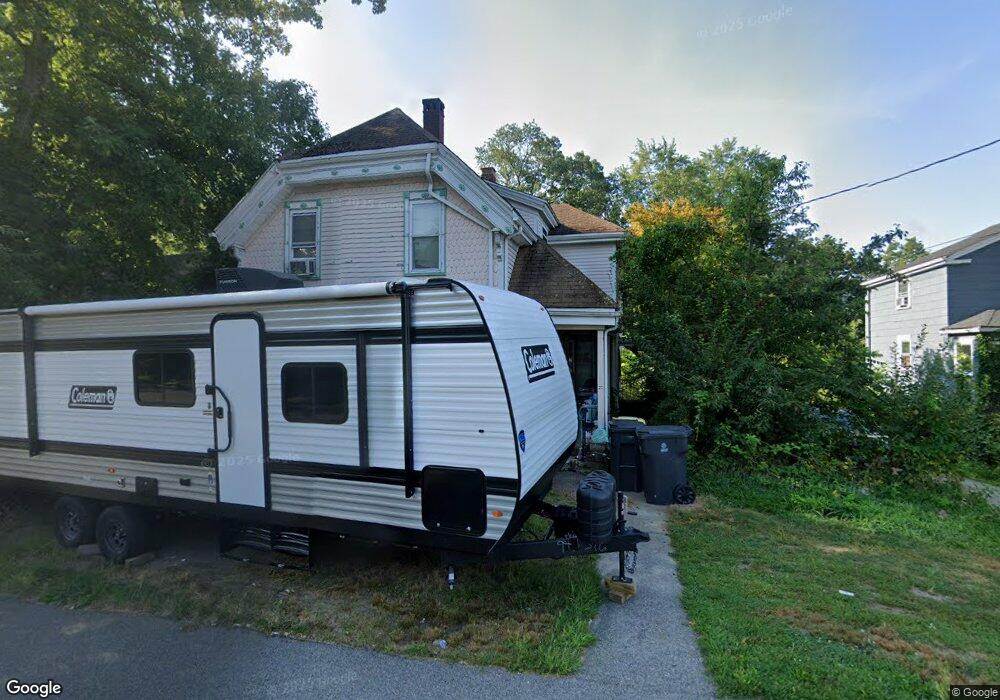
This home is located at 27 E High St, Avon, MA 02322 and is currently estimated at $585,447, approximately $291 per square foot. 27 E High St is a home located in Norfolk County with nearby schools including Ralph D. Butler Elementary School, Avon Middle/High School, and Lighthouse Baptist Christian Academy.
Ownership History
Date
Name
Owned For
Owner Type
Purchase Details
Closed on
Jun 28, 2011
Sold by
Nagle Ellen R
Bought by
Hart Daniel N and Hart Michele
Current Estimated Value
Home Financials for this Owner
Home Financials are based on the most recent Mortgage that was taken out on this home.
Original Mortgage
$233,916
Outstanding Balance
$162,738
Interest Rate
4.75%
Mortgage Type
FHA
Estimated Equity
$422,709
Purchase Details
Closed on
Apr 28, 1994
Sold by
Obrien Florence A
Bought by
Nagle Henry A and Nagle Ellen R
Home Financials for this Owner
Home Financials are based on the most recent Mortgage that was taken out on this home.
Original Mortgage
$50,000
Interest Rate
7.7%
Mortgage Type
Purchase Money Mortgage
Create a Home Valuation Report for This Property
The Home Valuation Report is an in-depth analysis detailing your home's value as well as a comparison with similar homes in the area
Home Values in the Area
Average Home Value in this Area
Purchase History
We collect this data history from publicly available records. To have your information removed, we recommend requesting removal directly through your county’s website.
| Date | Buyer | Sale Price | Title Company |
|---|---|---|---|
| Hart Daniel N | $240,000 | -- | |
| Nagle Henry A | $115,000 | -- |
Source: Public Records
Mortgage History
We collect this data history from publicly available records. To have your information removed, we recommend requesting removal directly through your county’s website.
| Date | Status | Borrower | Loan Amount |
|---|---|---|---|
| Open | Hart Daniel N | $233,916 | |
| Previous Owner | Nagle Henry A | $50,000 |
Source: Public Records
Tax History
| Year | Tax Paid | Tax Assessment Tax Assessment Total Assessment is a certain percentage of the fair market value that is determined by local assessors to be the total taxable value of land and additions on the property. | Land | Improvement |
|---|---|---|---|---|
| 2025 | $52 | $391,700 | $187,100 | $204,600 |
| 2024 | $4,962 | $353,700 | $177,400 | $176,300 |
| 2023 | $4,817 | $353,700 | $177,400 | $176,300 |
| 2022 | $4,817 | $304,700 | $147,900 | $156,800 |
| 2021 | $4,554 | $271,400 | $134,100 | $137,300 |
| 2020 | $5,016 | $283,400 | $131,500 | $151,900 |
| 2019 | $4,899 | $272,300 | $131,500 | $140,800 |
| 2018 | $5,051 | $272,300 | $131,500 | $140,800 |
| 2017 | $4,833 | $279,700 | $131,500 | $148,200 |
| 2016 | $4,839 | $282,800 | $131,600 | $151,200 |
| 2015 | $4,145 | $253,200 | $119,600 | $133,600 |
Source: Public Records
Map
Nearby Homes
- 150 E High St
- 747 S Main St
- 192 E Spring St
- 196 E Main St Unit C
- 191 E Spring St
- 193 E Spring St
- 66 Frederickson Dr
- 71 W Spring St
- 10 N Glenway Ave
- 12 Brentwood Ave
- 499 South St
- 595 South St
- 14 Leonard Ln
- 38 Druid Hill Ave E
- 15 Jefferson Rd
- 447 E Main St
- 20 Millhouse Ave
- 4 Ell Rd
- 35 Hillsdale Rd
- 125 Burkeside Ave
Your Personal Tour Guide
Ask me questions while you tour the home.