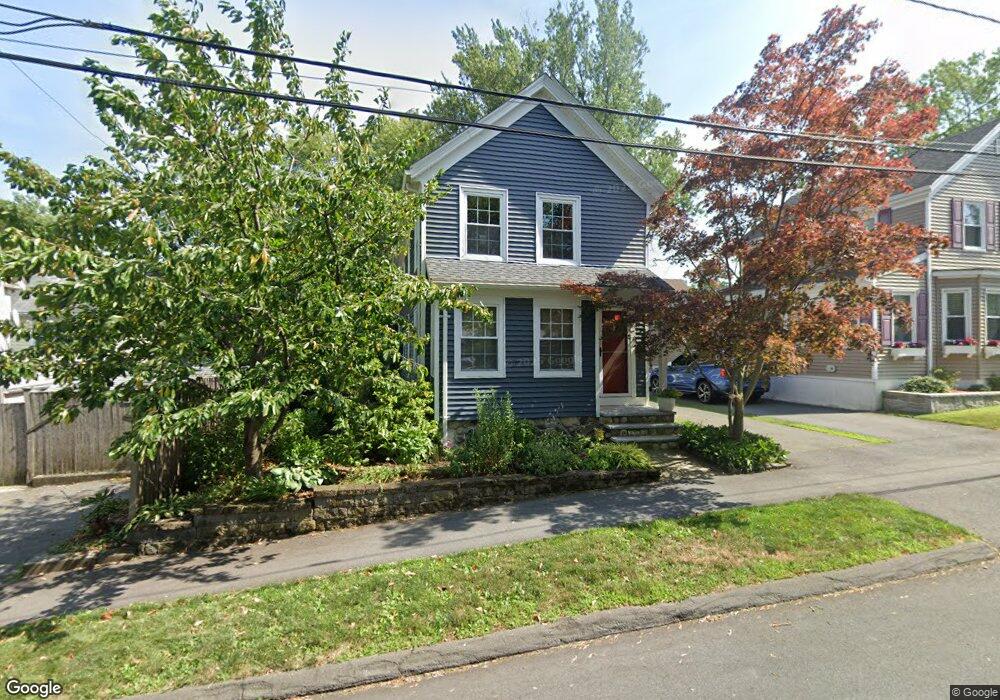
27 Fowler St Danvers, MA 01923
Estimated Value: $579,000 - $639,000
3
Beds
2
Baths
1,107
Sq Ft
$555/Sq Ft
Est. Value
About This Home
This home is located at 27 Fowler St, Danvers, MA 01923 and is currently estimated at $613,999, approximately $554 per square foot. 27 Fowler St is a home located in Essex County with nearby schools including Danvers High School and St. Mary of the Annunciation School.
Ownership History
Date
Name
Owned For
Owner Type
Purchase Details
Closed on
Jul 19, 2004
Sold by
Espinal-Parsons Estenia and Parsons Scott E
Bought by
Fournier Robert J and Samodai Nova D
Current Estimated Value
Purchase Details
Closed on
Jan 28, 1994
Sold by
Watson Kenneth A and Watson Paula
Bought by
Parsons Scott E and Espinal Esrenia
Create a Home Valuation Report for This Property
The Home Valuation Report is an in-depth analysis detailing your home's value as well as a comparison with similar homes in the area
Home Values in the Area
Average Home Value in this Area
Purchase History
We collect this data history from publicly available records. To have your information removed, we recommend requesting removal directly through your county’s website.
| Date | Buyer | Sale Price | Title Company |
|---|---|---|---|
| Fournier Robert J | $297,500 | -- | |
| Parsons Scott E | $111,000 | -- |
Source: Public Records
Mortgage History
We collect this data history from publicly available records. To have your information removed, we recommend requesting removal directly through your county’s website.
| Date | Status | Borrower | Loan Amount |
|---|---|---|---|
| Open | Parsons Scott E | $287,700 | |
| Closed | Parsons Scott E | $73,700 | |
| Closed | Parsons Scott E | $294,300 |
Source: Public Records
Tax History
| Year | Tax Paid | Tax Assessment Tax Assessment Total Assessment is a certain percentage of the fair market value that is determined by local assessors to be the total taxable value of land and additions on the property. | Land | Improvement |
|---|---|---|---|---|
| 2025 | $6,037 | $549,300 | $323,600 | $225,700 |
| 2024 | $5,916 | $532,500 | $312,500 | $220,000 |
| 2023 | $5,592 | $475,900 | $282,300 | $193,600 |
| 2022 | $5,508 | $435,100 | $256,700 | $178,400 |
| 2021 | $5,331 | $399,300 | $244,400 | $154,900 |
| 2020 | $5,215 | $399,300 | $244,400 | $154,900 |
| 2019 | $4,927 | $371,000 | $212,000 | $159,000 |
| 2018 | $4,746 | $350,500 | $212,000 | $138,500 |
| 2017 | $4,627 | $326,100 | $193,100 | $133,000 |
| 2016 | $4,443 | $312,900 | $184,100 | $128,800 |
| 2015 | $4,172 | $279,800 | $161,800 | $118,000 |
Source: Public Records
Map
Nearby Homes
- 62 Purchase St Unit C3
- 95 Abington Rd Unit 95
- 45 Abington Rd Unit 45
- 8 Putnam St Unit 3
- 4 Alden St Unit 3
- 19 Edmunds Cove
- 162 High St Unit B
- 166 High St
- 97 Sylvan St Unit 7
- 6 Jersey Ln
- 130 Pine St
- 180 Conant Conant St
- 90 Water St
- 58 River St Unit 3
- 22 Burley St
- 146 Hobart St
- 35 Collins St Unit 88
- 11 Macarthur Blvd Unit B
- 27 Garfield Ave
- 68 Prospect St Unit 16
Your Personal Tour Guide
Ask me questions while you tour the home.