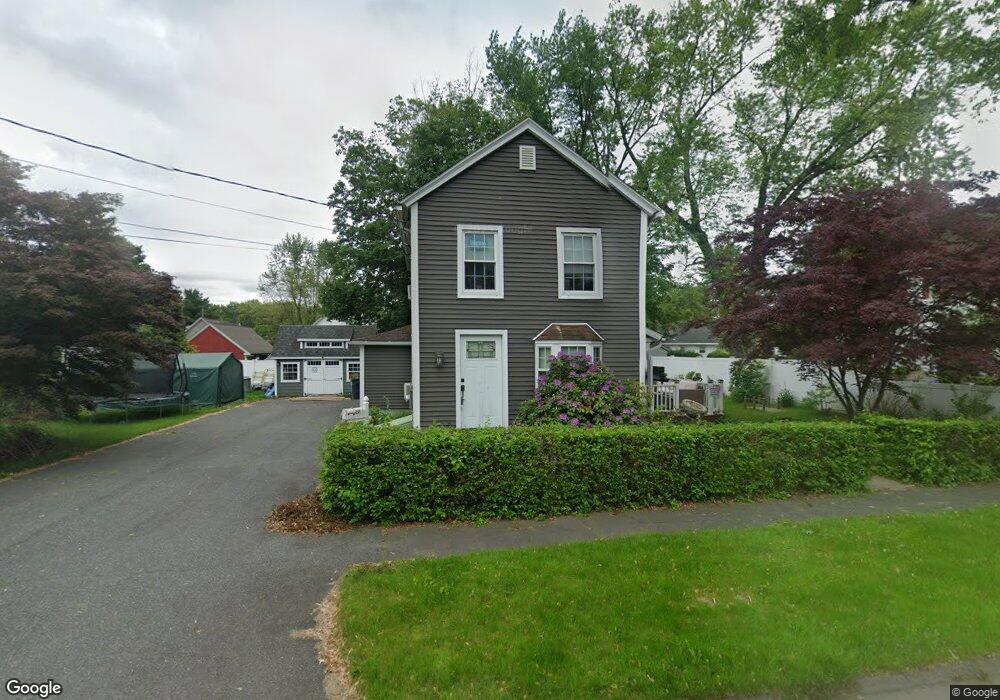
27 Fowler St Westfield, MA 01085
Estimated Value: $260,000 - $299,000
3
Beds
1
Bath
1,140
Sq Ft
$243/Sq Ft
Est. Value
About This Home
This home is located at 27 Fowler St, Westfield, MA 01085 and is currently estimated at $277,177, approximately $243 per square foot. 27 Fowler St is a home located in Hampden County with nearby schools including Westfield High School and Saint Mary High School.
Ownership History
Date
Name
Owned For
Owner Type
Purchase Details
Closed on
May 27, 1997
Sold by
Carson James C
Bought by
Stark Karl A and Stark Cynthia L
Current Estimated Value
Home Financials for this Owner
Home Financials are based on the most recent Mortgage that was taken out on this home.
Original Mortgage
$68,558
Interest Rate
8.08%
Mortgage Type
Purchase Money Mortgage
Purchase Details
Closed on
Mar 22, 1988
Sold by
Mikelis Jamess C
Bought by
Carson James C
Create a Home Valuation Report for This Property
The Home Valuation Report is an in-depth analysis detailing your home's value as well as a comparison with similar homes in the area
Home Values in the Area
Average Home Value in this Area
Purchase History
| Date | Buyer | Sale Price | Title Company |
|---|---|---|---|
| Stark Karl A | $68,000 | -- | |
| Carson James C | $82,000 | -- |
Source: Public Records
Mortgage History
| Date | Status | Borrower | Loan Amount |
|---|---|---|---|
| Open | Carson James C | $85,000 | |
| Closed | Carson James C | $68,558 | |
| Previous Owner | Carson James C | $8,500 |
Source: Public Records
Tax History
| Year | Tax Paid | Tax Assessment Tax Assessment Total Assessment is a certain percentage of the fair market value that is determined by local assessors to be the total taxable value of land and additions on the property. | Land | Improvement |
|---|---|---|---|---|
| 2025 | $3,220 | $212,100 | $77,600 | $134,500 |
| 2024 | $3,100 | $194,100 | $70,600 | $123,500 |
| 2023 | $2,983 | $175,700 | $67,300 | $108,400 |
| 2022 | $2,860 | $154,700 | $60,100 | $94,600 |
| 2021 | $1,376 | $145,700 | $56,600 | $89,100 |
| 2020 | $121 | $138,900 | $56,600 | $82,300 |
| 2019 | $2,598 | $132,100 | $53,900 | $78,200 |
| 2018 | $128 | $132,100 | $53,900 | $78,200 |
| 2017 | $122 | $128,200 | $54,800 | $73,400 |
| 2016 | $2,492 | $128,200 | $54,800 | $73,400 |
| 2015 | $2,377 | $128,200 | $54,800 | $73,400 |
| 2014 | $1,774 | $128,200 | $54,800 | $73,400 |
Source: Public Records
Map
Nearby Homes
- 114 Otis St Unit C
- 100 Meadow St
- 145 Main St
- 97 Mechanic St
- 205 Elm St
- 88 Woodmont St
- Lot 5 Montgomery
- 9 Montgomery St
- 19 Kellogg St
- 13 Green Ave
- 13 Hampden St
- 20 Perkins St
- 0 Lockhouse Rd Unit 73496193
- 64 Brookline Ave
- 19 Arch Rd
- 16 Squawfield Rd
- 289 Holyoke Rd
- 25 Coolidge Ave
- 70 S Maple St
- 82 S Maple St Unit 31
Your Personal Tour Guide
Ask me questions while you tour the home.