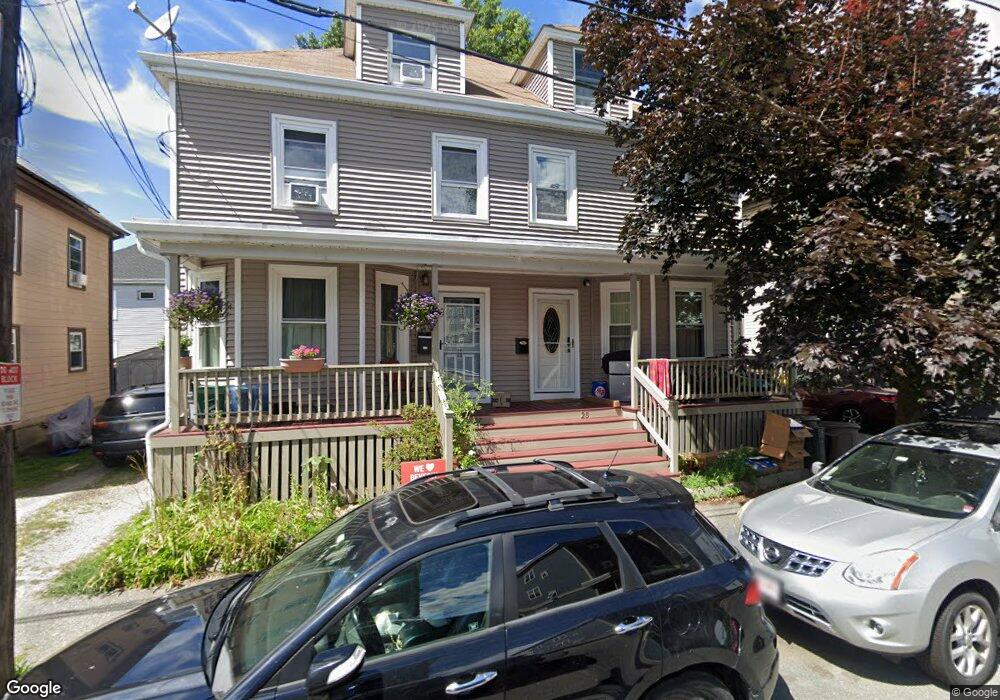
27 Grant St Beverly, MA 01915
Gloucester Crossing NeighborhoodEstimated Value: $501,489 - $623,000
About This Home
This home is located at 27 Grant St, Beverly, MA 01915 and is currently estimated at $553,872, approximately $322 per square foot. 27 Grant St is a home located in Essex County with nearby schools including Beverly High School, Shore Country Day School, and The Saints Academy.
Ownership History
We collect this data history from publicly available records. To have your information removed, we recommend requesting removal directly through your county’s website.
Purchase Details
Home Financials for this Owner
Home Financials are based on the most recent Mortgage that was taken out on this home.Purchase Details
Purchase Details
Home Values in the Area
Average Home Value in this Area
Purchase History
We collect this data history from publicly available records. To have your information removed, we recommend requesting removal directly through your county’s website.
| Date | Buyer | Sale Price | Title Company |
|---|---|---|---|
| $240,000 | -- | ||
| -- | -- | ||
| $239,000 | -- |
Mortgage History
We collect this data history from publicly available records. To have your information removed, we recommend requesting removal directly through your county’s website.
| Date | Status | Borrower | Loan Amount |
|---|---|---|---|
| Open | $172,151 | ||
| Closed | $40,000 | ||
| Closed | $192,000 | ||
| Closed | $24,000 |
Tax History
We collect this data history from publicly available records. To have your information removed, we recommend requesting removal directly through your county’s website.
| Year | Tax Paid | Tax Assessment Tax Assessment Total Assessment is a certain percentage of the fair market value that is determined by local assessors to be the total taxable value of land and additions on the property. | Land | Improvement |
|---|---|---|---|---|
| 2025 | $3,972 | $361,400 | $0 | $361,400 |
| 2024 | $3,744 | $333,400 | $0 | $333,400 |
| 2023 | $3,438 | $305,300 | $0 | $305,300 |
| 2022 | $3,489 | $286,700 | $0 | $286,700 |
| 2021 | $3,385 | $266,500 | $0 | $266,500 |
| 2020 | $3,142 | $244,900 | $0 | $244,900 |
| 2019 | $3,024 | $228,900 | $0 | $228,900 |
| 2018 | $2,984 | $219,400 | $0 | $219,400 |
| 2017 | $2,997 | $209,900 | $0 | $209,900 |
| 2016 | $2,969 | $206,300 | $0 | $206,300 |
| 2015 | $2,911 | $206,300 | $0 | $206,300 |
Map
- 2 Mill St
- 17 Ames St
- 37 Chase St
- 348 Rantoul St Unit 202
- 21 Whitney Ave Unit 1
- 335 Cabot St
- 492 Cabot St Unit 1A
- 50 Balch St Unit 111
- 50 Balch St Unit 507
- 50 Balch St Unit 405
- 50 Balch St Unit 309
- 50 Balch St Unit 303
- 501 Cabot St Unit 2
- 17 Kernwood Heights
- 8 Baker Ave
- 21 Goldsmith Ave
- 44 Charnock St
- 526 Cabot St
- 22 Butman St Unit 1
- 18 James St
Ask me questions while you tour the home.