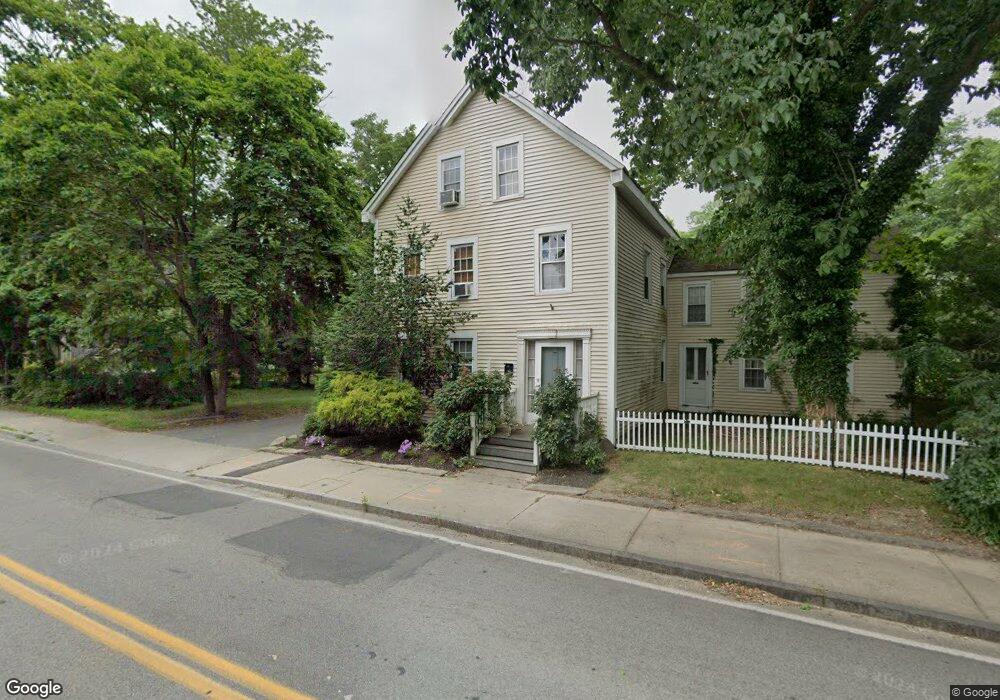
27 Main St Acushnet, MA 02743
Upper Acushnet NeighborhoodEstimated Value: $550,000 - $624,119
4
Beds
2
Baths
3,087
Sq Ft
$189/Sq Ft
Est. Value
About This Home
This home is located at 27 Main St, Acushnet, MA 02743 and is currently estimated at $583,530, approximately $189 per square foot. 27 Main St is a home located in Bristol County with nearby schools including Acushnet Elementary School, Albert F Ford Middle School, and Alma Del Mar Charter School.
Ownership History
Date
Name
Owned For
Owner Type
Purchase Details
Closed on
Mar 12, 1998
Sold by
Arne Debra G
Bought by
Lygren Michael D and Lygren Sandra
Current Estimated Value
Home Financials for this Owner
Home Financials are based on the most recent Mortgage that was taken out on this home.
Original Mortgage
$110,580
Interest Rate
7.03%
Mortgage Type
Purchase Money Mortgage
Create a Home Valuation Report for This Property
The Home Valuation Report is an in-depth analysis detailing your home's value as well as a comparison with similar homes in the area
Home Values in the Area
Average Home Value in this Area
Purchase History
We collect this data history from publicly available records. To have your information removed, we recommend requesting removal directly through your county’s website.
| Date | Buyer | Sale Price | Title Company |
|---|---|---|---|
| Lygren Michael D | $114,000 | -- |
Source: Public Records
Mortgage History
We collect this data history from publicly available records. To have your information removed, we recommend requesting removal directly through your county’s website.
| Date | Status | Borrower | Loan Amount |
|---|---|---|---|
| Open | Lygren Michael D | $107,000 | |
| Closed | Lygren Michael D | $110,000 | |
| Closed | Lygren Michael D | $110,580 |
Source: Public Records
Tax History
| Year | Tax Paid | Tax Assessment Tax Assessment Total Assessment is a certain percentage of the fair market value that is determined by local assessors to be the total taxable value of land and additions on the property. | Land | Improvement |
|---|---|---|---|---|
| 2025 | $64 | $593,300 | $195,700 | $397,600 |
| 2024 | $5,892 | $516,400 | $185,700 | $330,700 |
| 2023 | $5,374 | $447,800 | $168,500 | $279,300 |
| 2022 | $5,081 | $382,900 | $159,500 | $223,400 |
| 2021 | $5,066 | $366,300 | $159,500 | $206,800 |
| 2020 | $4,981 | $357,300 | $150,500 | $206,800 |
| 2019 | $4,824 | $340,200 | $144,500 | $195,700 |
| 2018 | $4,691 | $325,300 | $144,500 | $180,800 |
| 2017 | $4,586 | $317,600 | $144,500 | $173,100 |
| 2016 | $4,344 | $299,000 | $144,500 | $154,500 |
| 2015 | $4,270 | $299,000 | $144,500 | $154,500 |
Source: Public Records
Map
Nearby Homes
- 15 Jean St
- 11 Boylston St
- 15 Hiram St
- 34 Plympton St
- 54 Slocum St
- 81 Sylvia St
- 14 Hayes St Unit 1
- 62 Maryland St
- 14 Ludlow St
- 2453 Acushnet Ave
- 1934 Acushnet Ave
- 97 Middle Rd
- 1930 Acushnet Ave
- 34 Harbeck St
- 6 Middlefield Place
- 23 Oliveira Ave
- 259 Jarry St
- 264 Appleton St
- 204 Lowell St
- 148 Princeton St
Your Personal Tour Guide
Ask me questions while you tour the home.