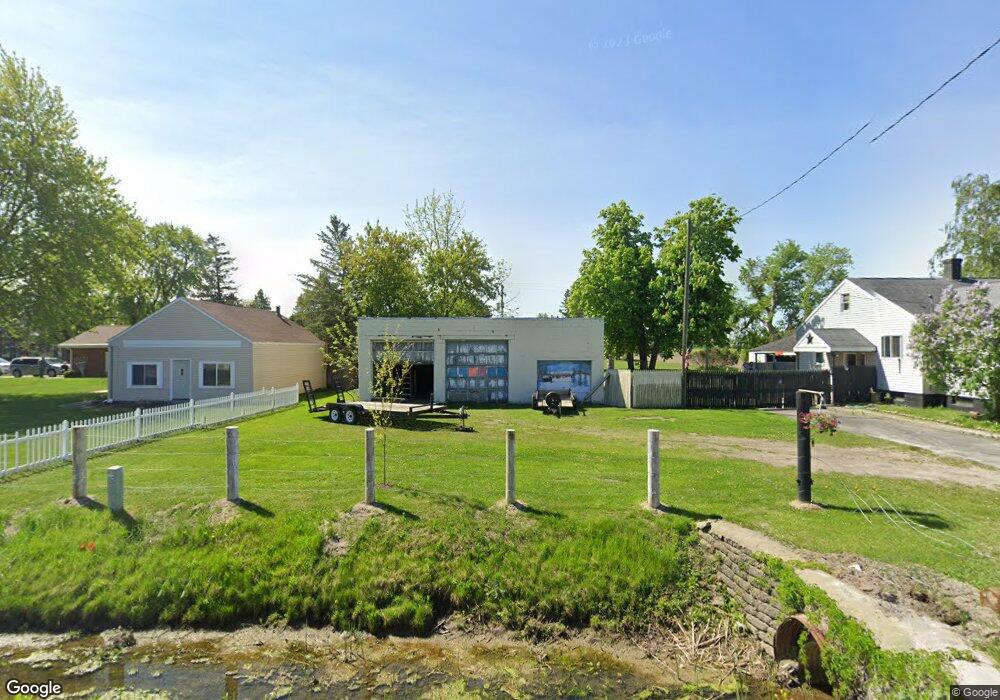
27 W Munger Rd Munger, MI 48747
Estimated Value: $64,000 - $163,000
2
Beds
1
Bath
1,104
Sq Ft
$118/Sq Ft
Est. Value
About This Home
This home is located at 27 W Munger Rd, Munger, MI 48747 and is currently estimated at $130,560, approximately $118 per square foot. 27 W Munger Rd is a home located in Bay County with nearby schools including Hampton Elementary School, Handy Middle School, and Bay City Central High School.
Ownership History
Date
Name
Owned For
Owner Type
Purchase Details
Closed on
May 7, 2024
Sold by
Stuck Alan D
Bought by
Cynthia Irwin Llc
Current Estimated Value
Home Financials for this Owner
Home Financials are based on the most recent Mortgage that was taken out on this home.
Original Mortgage
$48,000
Outstanding Balance
$45,520
Interest Rate
8.04%
Mortgage Type
New Conventional
Estimated Equity
$85,040
Purchase Details
Closed on
Aug 6, 2018
Sold by
Stuck Alan D
Bought by
Schleicher Michael Wayne
Purchase Details
Closed on
Nov 25, 1985
Sold by
Schnettler Leona
Bought by
Stuck Alan D
Create a Home Valuation Report for This Property
The Home Valuation Report is an in-depth analysis detailing your home's value as well as a comparison with similar homes in the area
Purchase History
| Date | Buyer | Sale Price | Title Company |
|---|---|---|---|
| Cynthia Irwin Llc | $60,000 | Midland Title | |
| Schleicher Michael Wayne | $50,000 | None Listed On Document | |
| Stuck Alan D | $40,000 | -- |
Source: Public Records
Mortgage History
| Date | Status | Borrower | Loan Amount |
|---|---|---|---|
| Open | Cynthia Irwin Llc | $48,000 |
Source: Public Records
Tax History
| Year | Tax Paid | Tax Assessment Tax Assessment Total Assessment is a certain percentage of the fair market value that is determined by local assessors to be the total taxable value of land and additions on the property. | Land | Improvement |
|---|---|---|---|---|
| 2025 | $2,327 | $66,550 | $0 | $0 |
| 2024 | $1,353 | $58,900 | $0 | $0 |
| 2023 | $618 | $49,600 | $0 | $0 |
| 2022 | $1,317 | $49,250 | $0 | $0 |
| 2021 | $1,210 | $44,950 | $10,500 | $34,450 |
| 2020 | $1,184 | $33,500 | $10,500 | $23,000 |
| 2019 | $1,180 | $33,050 | $0 | $0 |
| 2018 | $1,737 | $32,350 | $0 | $0 |
| 2017 | $1,822 | $34,200 | $0 | $0 |
| 2016 | $1,845 | $36,600 | $8,500 | $28,100 |
| 2015 | -- | $34,400 | $8,500 | $25,900 |
| 2014 | -- | $35,000 | $6,800 | $28,200 |
Source: Public Records
Map
Nearby Homes
- 2239 S Tuscola Rd
- 2055 S Farley Rd
- 0 W Munger Rd
- 1245 S Pine Rd
- 3705 N Beyer Rd
- 513 W Ridge Rd
- 618 N Jones Rd
- 743 N Jones Rd
- E E Center Rd
- 568 W Center Rd
- 811 SE Boutell Rd
- 1870 Morin Dr
- 0 Eastland Dr
- 0 E Nebobish Rd
- 1238 W Center Rd
- 1708 W Ridge Rd
- 821 Whispering Pines Ln
- 911 S Powell Rd
- 1083 S Van Buren Rd
- 0 River Rd
- 1520 S Finn Rd
- 1530 S Finn Rd
- 12 W Munger Rd
- 10 E Munger Rd
- 1540 S Finn Rd
- 1477 Madajski Rd
- 1539 S Finn Rd
- 1552 S Finn Rd
- VL Madajski Rd
- 1480 Madajski Rd
- 1468 S Finn Rd
- 60 W Munger Rd
- 56 E Munger Rd
- 1557 S Finn Rd
- 67 W Munger Rd
- 66 W Munger Rd
- 1473 S Finn Rd
- 1473 S Finn Rd
- 38 E Munger Rd
- 1463 S Finn Rd
Your Personal Tour Guide
Ask me questions while you tour the home.