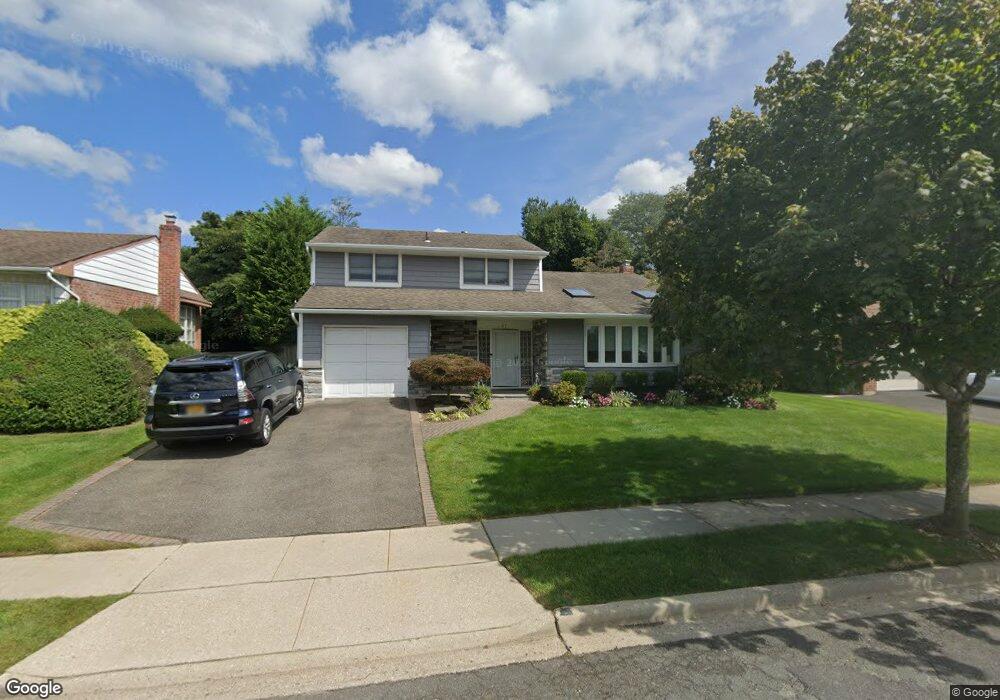
NOT LISTED FOR SALE

Estimated Value: $934,944 - $940,000

-- Bed
3 Baths
1,292 Sq Ft
$726/Sq Ft Est. Value

About This Home

This home is located at 27 Whitlock St, Plainview, NY 11803 and is currently estimated at $937,472, approximately $725 per square foot. 27 Whitlock St is a home located in Nassau County with nearby schools including Judy Jacobs Parkway Elementary School, H B Mattlin Middle School, and Plainview-Old Bethpage John F. Kennedy High School.

Ownership History

Date Name Owned For Owner Type

Purchase Details

Closed on
Jan 25, 2019
Sold by
Spitalny Lisa
Bought by
Bleimann George and Spitalny Lisa
Current Estimated Value
$937,472

Home Financials for this Owner

Home Financials are based on the most recent Mortgage that was taken out on this home.
Original Mortgage
$12,547
Interest Rate
4.5%
Mortgage Type
New Conventional

Purchase Details

Closed on
Dec 4, 2018
Sold by
Spitalny Aaron D and Spitalny Lisa
Bought by
Spitalny Lisa

Home Financials for this Owner

Home Financials are based on the most recent Mortgage that was taken out on this home.
Original Mortgage
$12,547
Interest Rate
4.5%
Mortgage Type
New Conventional

Purchase Details

Closed on
Aug 16, 2007
Sold by
Weiser Sandra
Bought by
Spitalny Aaron

Purchase Details

Closed on
Jan 15, 1996
Sold by
Weiser Lawrence and Weiser Sandra
Bought by
Weiser Sandra

Range of Values:

Collateral Analytics

Collateral Analytics Collateral Analytics AVMs (Automated Valuation Model) employ a number of statistical approaches combined with neighborhood-specific comparable selection guarantees the most up-to-date and precise valuations.

Not Available

Collateral Analytics does not have data for the current month. Please view the chart for historical values.

ICE

ICE Mortgage Technology ICE Mortgage Technology’s AVM (Automated Valuation Model) is a state-of-the-art online residential property valuation tool that provides a quick and accurate estimate of the value of almost any home in the U.S.

Not Available

ICE Mortgage Technology does not have data for the current month. Please view the chart for historical values.

First American

First American First American Data & Analytics’ next-generation AVM combines unrivaled data assets with a blended ensemble of valuation models to produce highly accurate, reliable valuations you can trust.

Not Available

First American does not have data for the current month. Please view the chart for historical values.

Quantarium

Quantarium Quantarium’s valuation service, repeatedly proven the industry’s most accurate and comprehensive, is supercharged with a self-learning and auto-tuning AI engine that continually becomes smarter and more accurate as it processes daily inputs from the industry’s leading RE data lake.

Not Available

Quantarium does not have data for the current month. Please view the chart for historical values.

Average Value
Not Available
List Price
Sold Price
Create a Home Valuation Report for This Property
The Home Valuation Report is an in-depth analysis detailing your home's value as well as a comparison with similar homes in the area

Home Values in the Area

Source: Public Records

Average Home Value in this Area


Source: Public Records

Purchase History

Date Buyer Sale Price Title Company
Bleimann George -- Old Republic Title
Spitalny Lisa $82,610 Advantage Title
Spitalny Aaron $575,000 --
Weiser Sandra -- --
Source: Public Records

Mortgage History

Date Status Borrower Loan Amount
Open Bleimann George $13,245
Open Bleimann George $333,000
Closed Bleimann George $12,547
Source: Public Records

Tax History Compared to Growth

Source: Public Records

Tax History

Year Tax Paid Tax Assessment Tax Assessment Total Assessment is a certain percentage of the fair market value that is determined by local assessors to be the total taxable value of land and additions on the property. Land Improvement
2024 $5,365 $632 $324 $308
2023 $14,838 $611 $313 $298
2022 $14,838 $632 $324 $308
2021 $14,972 $623 $319 $304
2020 $14,187 $808 $566 $242
2019 $4,442 $808 $566 $242
2018 $8,636 $808 $0 $0
2017 $7,678 $808 $566 $242
2016 $11,701 $808 $541 $267
2015 $3,627 $808 $541 $267
2014 $3,627 $808 $541 $267
2013 $3,458 $846 $566 $280
Source: Public Records

Map