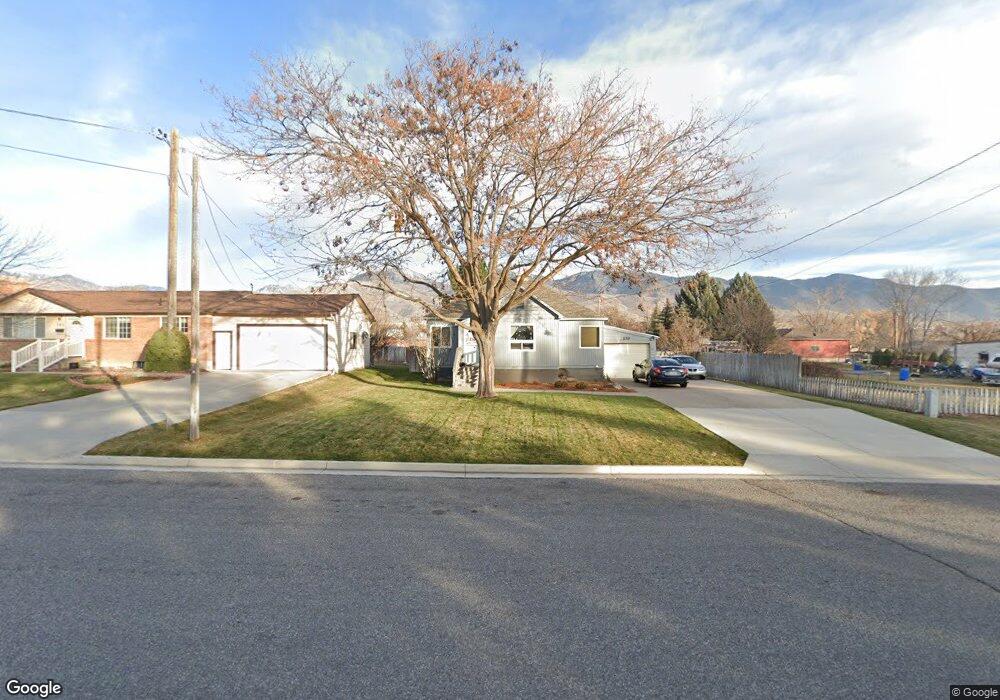
270 S 100 E Smithfield, UT 84335
Estimated Value: $338,000 - $393,000
Studio
--
Bath
904
Sq Ft
$398/Sq Ft
Est. Value
About This Home
This home is located at 270 S 100 E, Smithfield, UT 84335 and is currently estimated at $359,893, approximately $398 per square foot. 270 S 100 E is a home with nearby schools including Summit School, Cedar Ridge School, and North Cache Middle School.
Ownership History
Date
Name
Owned For
Owner Type
Purchase Details
Closed on
Nov 8, 2023
Sold by
Mcdonald Charlyn G
Bought by
Huffman Charlyn G and Huffman Don W
Current Estimated Value
Purchase Details
Closed on
Jun 29, 2022
Sold by
Mcdonald Charlyn G
Bought by
Mcdonald Charlyn G and Huffman Don W
Create a Home Valuation Report for This Property
The Home Valuation Report is an in-depth analysis detailing your home's value as well as a comparison with similar homes in the area
Home Values in the Area
Average Home Value in this Area
Purchase History
| Date | Buyer | Sale Price | Title Company |
|---|---|---|---|
| Huffman Charlyn G | -- | Hickman Land Title | |
| Mcdonald Charlyn G | -- | Hickman Land Title |
Source: Public Records
Tax History
| Year | Tax Paid | Tax Assessment Tax Assessment Total Assessment is a certain percentage of the fair market value that is determined by local assessors to be the total taxable value of land and additions on the property. | Land | Improvement |
|---|---|---|---|---|
| 2025 | $1,315 | $176,045 | $0 | $0 |
| 2024 | $1,577 | $198,000 | $0 | $0 |
| 2023 | $1,666 | $197,825 | $0 | $0 |
| 2022 | $1,474 | $172,280 | $0 | $0 |
| 2021 | $1,392 | $248,490 | $63,500 | $184,990 |
| 2020 | $1,236 | $205,800 | $63,500 | $142,300 |
| 2019 | $1,162 | $184,500 | $42,200 | $142,300 |
| 2018 | $897 | $137,736 | $42,200 | $95,536 |
| 2017 | $836 | $70,125 | $0 | $0 |
| 2016 | $851 | $70,125 | $0 | $0 |
| 2015 | $854 | $70,125 | $0 | $0 |
| 2014 | $838 | $70,120 | $0 | $0 |
| 2013 | -- | $63,430 | $0 | $0 |
Source: Public Records
Map
Nearby Homes
Your Personal Tour Guide
Ask me questions while you tour the home.