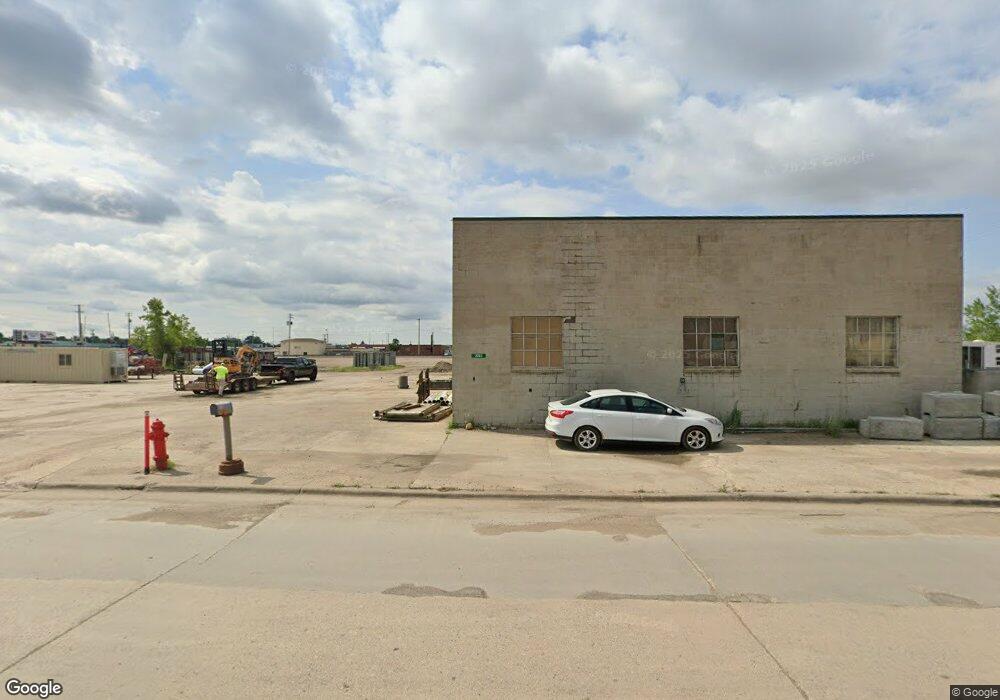
2702 1st Ave N Fargo, ND 58102
Village West NeighborhoodEstimated Value: $684,680
4
Beds
2
Baths
2,120
Sq Ft
$323/Sq Ft
Est. Value
About This Home
This home is located at 2702 1st Ave N, Fargo, ND 58102 and is currently estimated at $684,680, approximately $322 per square foot. 2702 1st Ave N is a home located in Cass County with nearby schools including Madison Elementary School, Ben Franklin Middle School, and North High School.
Ownership History
Date
Name
Owned For
Owner Type
Purchase Details
Closed on
Jun 11, 2019
Sold by
Northern Improvement Company
Bought by
Dirt Dynamics Llc
Current Estimated Value
Home Financials for this Owner
Home Financials are based on the most recent Mortgage that was taken out on this home.
Original Mortgage
$356,250
Interest Rate
4%
Mortgage Type
Purchase Money Mortgage
Create a Home Valuation Report for This Property
The Home Valuation Report is an in-depth analysis detailing your home's value as well as a comparison with similar homes in the area
Home Values in the Area
Average Home Value in this Area
Purchase History
| Date | Buyer | Sale Price | Title Company |
|---|---|---|---|
| Dirt Dynamics Llc | $475,000 | Trn Abstract & Title |
Source: Public Records
Mortgage History
| Date | Status | Borrower | Loan Amount |
|---|---|---|---|
| Closed | Dirt Dynamics Llc | $356,250 |
Source: Public Records
Tax History
| Year | Tax Paid | Tax Assessment Tax Assessment Total Assessment is a certain percentage of the fair market value that is determined by local assessors to be the total taxable value of land and additions on the property. | Land | Improvement |
|---|---|---|---|---|
| 2025 | $18,541 | $363,950 | $238,450 | $125,500 |
| 2024 | $19,764 | $400,200 | $174,000 | $226,200 |
| 2023 | $15,850 | $383,450 | $174,000 | $209,450 |
| 2022 | $14,517 | $335,100 | $174,000 | $161,100 |
| 2021 | $13,432 | $304,650 | $174,000 | $130,650 |
| 2020 | $12,360 | $272,000 | $174,000 | $98,000 |
| 2019 | $12,368 | $272,000 | $174,000 | $98,000 |
| 2018 | $8,541 | $143,000 | $116,000 | $27,000 |
| 2017 | $8,496 | $143,000 | $116,000 | $27,000 |
| 2016 | $8,099 | $143,000 | $116,000 | $27,000 |
| 2015 | $8,348 | $143,000 | $116,000 | $27,000 |
| 2014 | $8,450 | $143,000 | $116,000 | $27,000 |
| 2013 | $8,454 | $143,000 | $116,000 | $27,000 |
Source: Public Records
Map
Nearby Homes
Your Personal Tour Guide
Ask me questions while you tour the home.