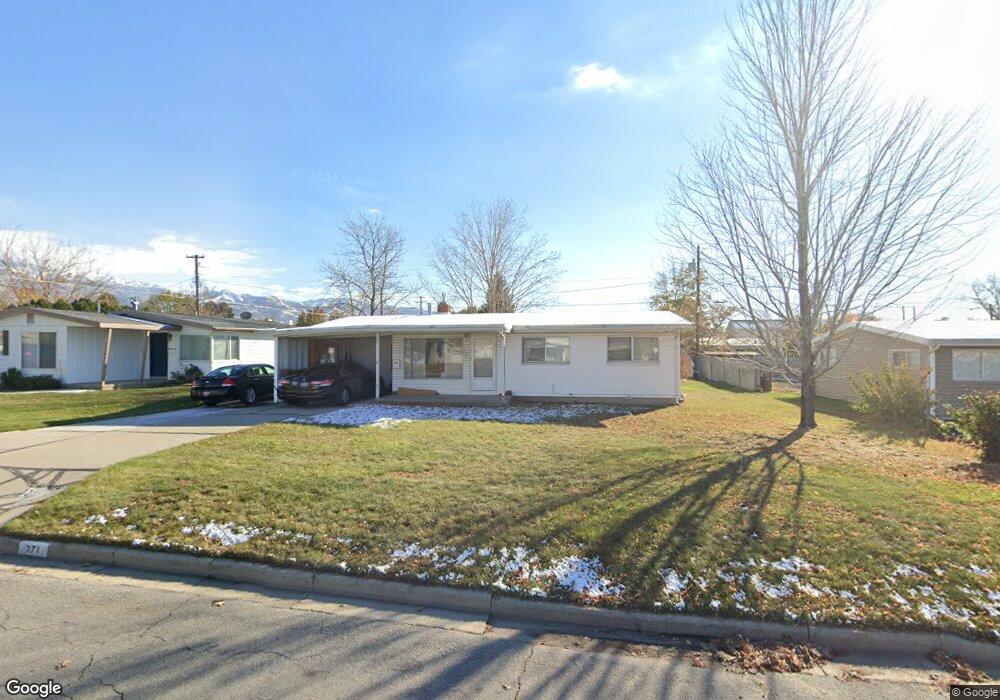
271 W 1050 N Bountiful, UT 84010
Estimated Value: $403,000 - $468,000
3
Beds
2
Baths
1,260
Sq Ft
$345/Sq Ft
Est. Value
About This Home
This home is located at 271 W 1050 N, Bountiful, UT 84010 and is currently estimated at $434,977, approximately $345 per square foot. 271 W 1050 N is a home located in Davis County with nearby schools including Meadowbrook Elementary School, Bountiful Junior High School, and Viewmont High School.
Ownership History
Date
Name
Owned For
Owner Type
Purchase Details
Closed on
Dec 22, 2022
Sold by
William Monte Bringhurst Living Trust
Bought by
Miller Linda and Bringhurst Richard
Current Estimated Value
Home Financials for this Owner
Home Financials are based on the most recent Mortgage that was taken out on this home.
Original Mortgage
$206,750
Outstanding Balance
$199,732
Interest Rate
6.27%
Estimated Equity
$235,245
Purchase Details
Closed on
Feb 10, 2012
Sold by
Bringhurst William Monte
Bought by
Bringhurst William Monte
Create a Home Valuation Report for This Property
The Home Valuation Report is an in-depth analysis detailing your home's value as well as a comparison with similar homes in the area
Purchase History
We collect this data history from publicly available records. To have your information removed, we recommend requesting removal directly through your county’s website.
| Date | Buyer | Sale Price | Title Company |
|---|---|---|---|
| Miller Linda | -- | -- | |
| Bringhurst William Monte | -- | None Available |
Source: Public Records
Mortgage History
We collect this data history from publicly available records. To have your information removed, we recommend requesting removal directly through your county’s website.
| Date | Status | Borrower | Loan Amount |
|---|---|---|---|
| Open | Miller Linda | $206,750 |
Source: Public Records
Tax History
| Year | Tax Paid | Tax Assessment Tax Assessment Total Assessment is a certain percentage of the fair market value that is determined by local assessors to be the total taxable value of land and additions on the property. | Land | Improvement |
|---|---|---|---|---|
| 2025 | $2,319 | $206,250 | $127,547 | $78,703 |
| 2024 | $2,184 | $202,950 | $112,587 | $90,363 |
| 2023 | $2,082 | $351,000 | $208,455 | $142,545 |
| 2022 | $2,078 | $191,950 | $114,184 | $77,766 |
| 2021 | $1,918 | $271,000 | $149,380 | $121,620 |
| 2020 | $1,692 | $239,000 | $127,978 | $111,022 |
| 2019 | $1,702 | $235,000 | $137,730 | $97,270 |
| 2018 | $1,566 | $212,000 | $135,067 | $76,933 |
| 2016 | $1,287 | $93,830 | $55,716 | $38,114 |
| 2015 | $1,250 | $85,855 | $55,716 | $30,139 |
| 2014 | $1,308 | $93,250 | $55,716 | $37,534 |
| 2013 | -- | $86,412 | $36,190 | $50,222 |
Source: Public Records
Map
Nearby Homes
- 888 N 250 W Unit 601
- 845 N 275 W
- 1130 N 200 W
- 553 N 200 W
- 66 W 700 N
- 65 W 700 N
- 34 W 800 N
- 18 W 900 N
- 1536 N 150 W
- 1115 N Main St
- 403 W 400 N Unit 1
- 1625 Pages Place
- 182 W 300 N Unit 4
- 1709 N 200 W Unit 7
- 290 N 500 W Unit 108
- 502 N Main St
- 3166 Linden Cir
- 55 N Peregrine Ln W Unit 4
- 31 Village Square Rd
- 449 W 200 N Unit 3
Your Personal Tour Guide
Ask me questions while you tour the home.