2710 Us Highway 84 E Cairo, GA 39828
Cairo AreaEstimated Value: $248,000 - $334,000
About This Home
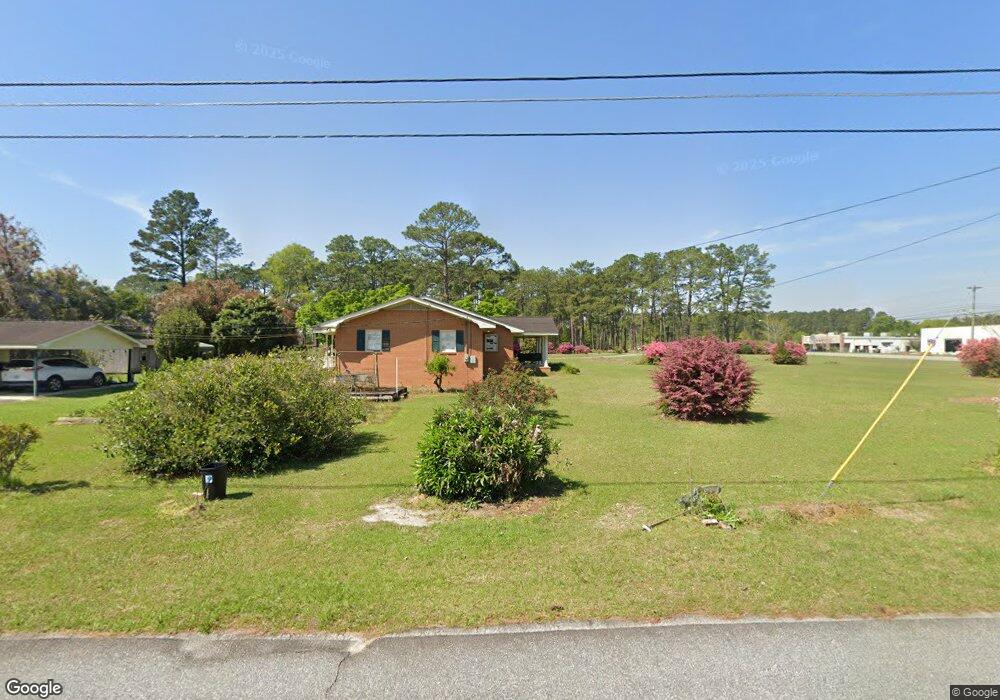
This home is located at 2710 Us Highway 84 E, Cairo, GA 39828 and is currently estimated at $297,893, approximately $127 per square foot. 2710 Us Highway 84 E is a home located in Grady County with nearby schools including Cairo High School.
Ownership History
We collect this data history from publicly available records. To have your information removed, we recommend requesting removal directly through your county’s website.
Purchase Details
Home Financials for this Owner
Home Financials are based on the most recent Mortgage that was taken out on this home.Purchase Details
Purchase Details
Purchase Details
Purchase History
We collect this data history from publicly available records. To have your information removed, we recommend requesting removal directly through your county’s website.
| Date | Buyer | Sale Price | Title Company |
|---|---|---|---|
| -- | -- | ||
| -- | -- | ||
| -- | -- | ||
| -- | -- |
Mortgage History
We collect this data history from publicly available records. To have your information removed, we recommend requesting removal directly through your county’s website.
| Date | Status | Borrower | Loan Amount |
|---|---|---|---|
| Open | $103,000 | ||
| Closed | $114,889 |
Tax History
We collect this data history from publicly available records. To have your information removed, we recommend requesting removal directly through your county’s website.
| Year | Tax Paid | Tax Assessment Tax Assessment Total Assessment is a certain percentage of the fair market value that is determined by local assessors to be the total taxable value of land and additions on the property. | Land | Improvement |
|---|---|---|---|---|
| 2025 | $2,732 | $102,004 | $14,366 | $87,638 |
| 2024 | $2,732 | $92,358 | $14,366 | $77,992 |
| 2023 | $2,264 | $62,820 | $15,498 | $47,322 |
| 2022 | $2,357 | $62,820 | $15,498 | $47,322 |
| 2021 | $2,363 | $62,820 | $15,498 | $47,322 |
| 2020 | $2,370 | $62,820 | $15,498 | $47,322 |
| 2019 | $2,369 | $62,820 | $15,498 | $47,322 |
| 2018 | $2,036 | $60,940 | $15,559 | $45,381 |
| 2017 | $1,963 | $60,940 | $15,559 | $45,381 |
| 2016 | $1,719 | $52,963 | $15,559 | $37,404 |
| 2015 | $1,699 | $52,963 | $15,559 | $37,404 |
| 2014 | $1,697 | $52,963 | $15,559 | $37,404 |
| 2013 | -- | $49,267 | $15,559 | $33,708 |
Map
- 85 28th St NE
- 78 27th St NE
- 2690 Us Highway 84 E
- 77 28th St NE
- 76 27th St NE
- 2807 Us Highway 84 E
- 74 28th St NE
- 73 28th St NE
- 74 27th St NE
- 2630 Pineacre Dr NE
- L 1 B2 Hall Rd
- 2600 U S 84
- 68 Hall Rd
- 2846 Bark Ave NE
- 78 26th St NE
- 2600 Us Highway 84 E
- 2600 Us Highway 84 E
- 71 28th St NE
- 72 27th St NE
- 2575 Pineacre Dr NE
Ask me questions while you tour the home.