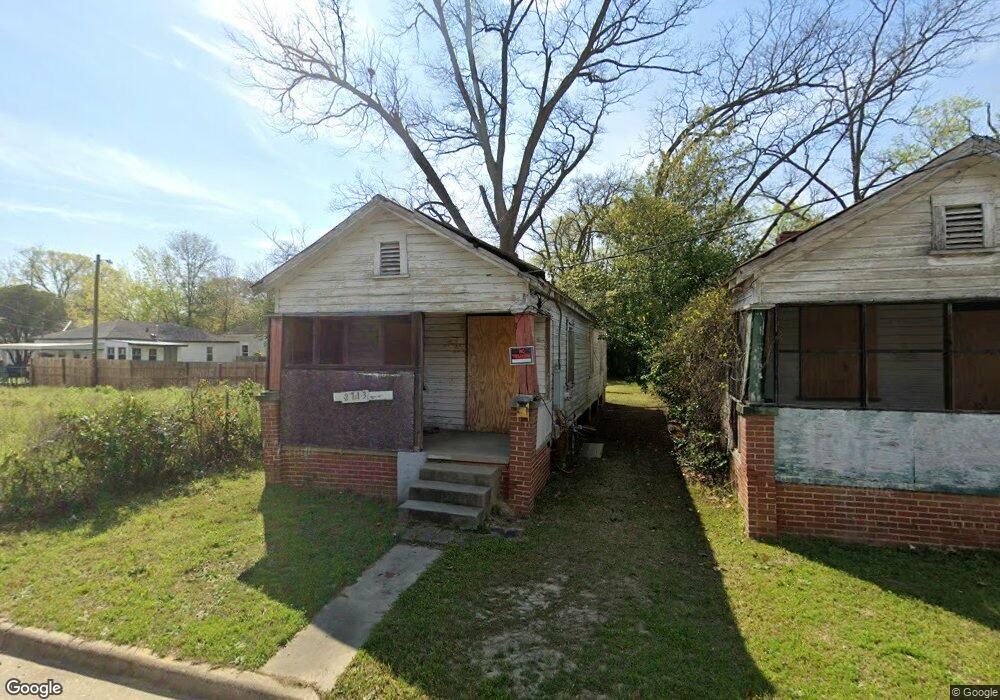
2713 16th Ave Columbus, GA 31901
East Highlands NeighborhoodEstimated Value: $152,000 - $222,000
1
Bed
2
Baths
644
Sq Ft
$283/Sq Ft
Est. Value
About This Home
This home is located at 2713 16th Ave, Columbus, GA 31901 and is currently estimated at $182,080, approximately $282 per square foot. 2713 16th Ave is a home located in Muscogee County with nearby schools including Hannan Elementary School, Arnold Middle School, and Jordan Vocational High School.
Ownership History
Date
Name
Owned For
Owner Type
Purchase Details
Closed on
Sep 28, 2021
Sold by
91 Properties Llc
Bought by
Michel R and 2713 16Th Ave Trust
Current Estimated Value
Home Financials for this Owner
Home Financials are based on the most recent Mortgage that was taken out on this home.
Original Mortgage
$150,000
Interest Rate
2.1%
Mortgage Type
New Conventional
Purchase Details
Closed on
Mar 28, 2014
Sold by
Davis Louise M
Bought by
Davis Charlotte
Create a Home Valuation Report for This Property
The Home Valuation Report is an in-depth analysis detailing your home's value as well as a comparison with similar homes in the area
Home Values in the Area
Average Home Value in this Area
Purchase History
| Date | Buyer | Sale Price | Title Company |
|---|---|---|---|
| Michel R | $119,800 | -- | |
| 91 Properties Llc | $60,000 | -- | |
| 2713 16Th Ave Trust | $119,800 | None Listed On Document | |
| 91 Properties Llc | -- | None Listed On Document | |
| Davis Charlotte | -- | -- | |
| Davis Louise M | -- | -- |
Source: Public Records
Mortgage History
| Date | Status | Borrower | Loan Amount |
|---|---|---|---|
| Closed | 2713 16Th Ave Trust | $150,000 |
Source: Public Records
Tax History
| Year | Tax Paid | Tax Assessment Tax Assessment Total Assessment is a certain percentage of the fair market value that is determined by local assessors to be the total taxable value of land and additions on the property. | Land | Improvement |
|---|---|---|---|---|
| 2025 | $5,545 | $63,868 | $5,536 | $58,332 |
| 2024 | $2,500 | $63,868 | $5,536 | $58,332 |
| 2023 | $2,516 | $63,868 | $5,536 | $58,332 |
| 2022 | $1,957 | $47,920 | $5,400 | $42,520 |
| 2021 | $937 | $22,948 | $5,536 | $17,412 |
| 2020 | $937 | $22,948 | $5,536 | $17,412 |
| 2019 | $940 | $22,948 | $5,536 | $17,412 |
| 2018 | $799 | $22,948 | $5,536 | $17,412 |
| 2017 | $943 | $22,948 | $5,536 | $17,412 |
| 2016 | $680 | $16,493 | $1,420 | $15,073 |
| 2015 | $272 | $16,493 | $1,420 | $15,073 |
| 2014 | $273 | $16,493 | $1,420 | $15,073 |
| 2013 | -- | $16,493 | $1,420 | $15,073 |
Source: Public Records
Map
Nearby Homes
Your Personal Tour Guide
Ask me questions while you tour the home.