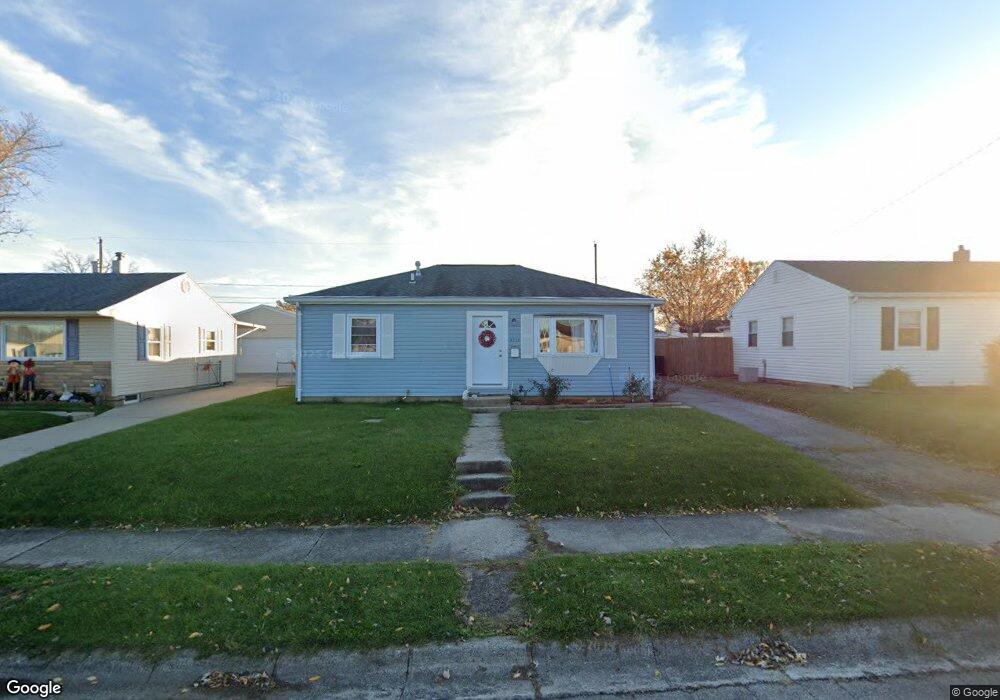
2713 Duncan St Springfield, OH 45505
Estimated Value: $109,000 - $131,000
About This Home
This home is located at 2713 Duncan St, Springfield, OH 45505 and is currently estimated at $117,072, approximately $143 per square foot. 2713 Duncan St is a home located in Clark County with nearby schools including Mann Elementary School, Schaefer Middle School, and Springfield High School.
Ownership History
We collect this data history from publicly available records. To have your information removed, we recommend requesting removal directly through your county’s website.
Purchase Details
Purchase Details
Purchase Details
Purchase Details
Home Values in the Area
Average Home Value in this Area
Purchase History
We collect this data history from publicly available records. To have your information removed, we recommend requesting removal directly through your county’s website.
| Date | Buyer | Sale Price | Title Company |
|---|---|---|---|
| $26,000 | Title365 | ||
| $40,000 | None Available | ||
| $33,300 | -- | ||
| $30,000 | -- |
Tax History
We collect this data history from publicly available records. To have your information removed, we recommend requesting removal directly through your county’s website.
| Year | Tax Paid | Tax Assessment Tax Assessment Total Assessment is a certain percentage of the fair market value that is determined by local assessors to be the total taxable value of land and additions on the property. | Land | Improvement |
|---|---|---|---|---|
| 2025 | $1,616 | $32,390 | $4,940 | $27,450 |
| 2024 | $1,164 | $23,560 | $4,620 | $18,940 |
| 2023 | $1,164 | $23,560 | $4,620 | $18,940 |
| 2022 | $1,192 | $23,560 | $4,620 | $18,940 |
| 2021 | $853 | $15,530 | $3,170 | $12,360 |
| 2020 | $855 | $15,530 | $3,170 | $12,360 |
| 2019 | $857 | $15,530 | $3,170 | $12,360 |
| 2018 | $890 | $15,480 | $2,650 | $12,830 |
| 2017 | $376 | $16,051 | $2,646 | $13,405 |
| 2016 | $377 | $16,051 | $2,646 | $13,405 |
| 2015 | $273 | $15,568 | $2,646 | $12,922 |
| 2014 | $543 | $15,568 | $2,646 | $12,922 |
| 2013 | $537 | $15,568 | $2,646 | $12,922 |
Map
- 708 Lawnview Ave
- 325 Gruen Dr
- 412 Cape Cod Dr
- 360 Buxton Ave
- 374 Raffensperger Ave
- 3012 E High St
- 631 Kramer Rd
- 422 Sherwood Park Dr
- 273 Raffensperger Ave
- 263 Raffensperger Ave
- 283 Raffensperger Ave
- 306 S Clairmont Ave
- 266 S Clairmont Ave
- 270 S Clairmont Ave
- 302 S Clairmont Ave
- 264 S Clairmont Ave
- 138 Lawnview Ave
- 280 S Clairmont Ave
- 115 S Burnett Rd
- 111 S Burnett Rd
Ask me questions while you tour the home.