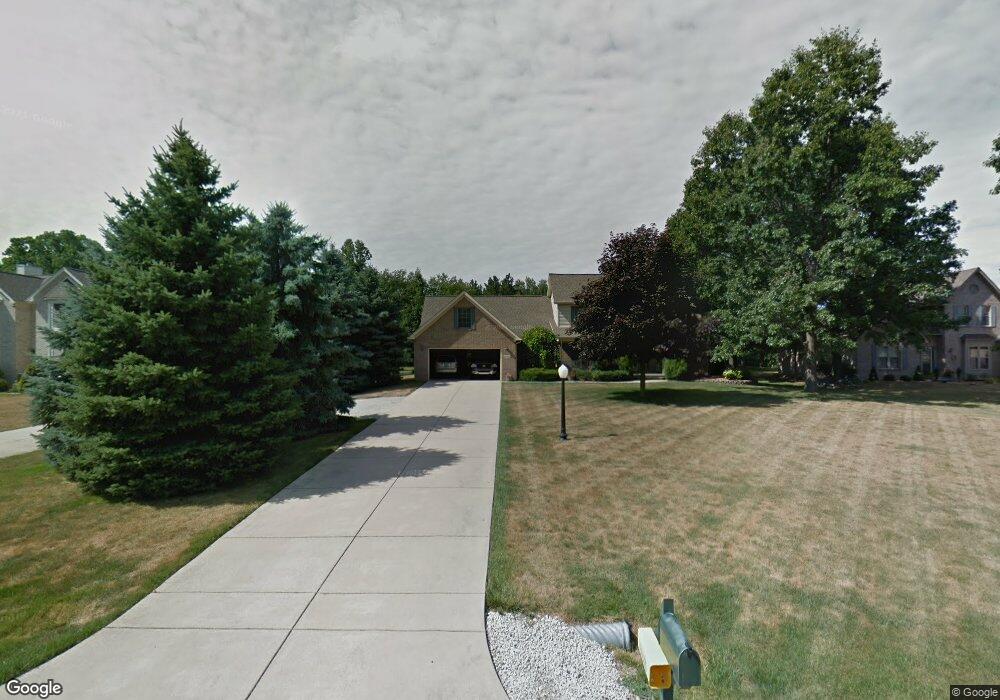
27163 Bryan Blvd Unit 23 New Boston, MI 48164
Estimated Value: $431,024 - $497,000
4
Beds
3
Baths
2,400
Sq Ft
$194/Sq Ft
Est. Value
About This Home
This home is located at 27163 Bryan Blvd Unit 23, New Boston, MI 48164 and is currently estimated at $465,256, approximately $193 per square foot. 27163 Bryan Blvd Unit 23 is a home located in Wayne County with nearby schools including Huron High School and St John's Lutheran School.
Ownership History
Date
Name
Owned For
Owner Type
Purchase Details
Closed on
Mar 11, 2011
Sold by
Szabo Michael T and Szabo Angela M
Bought by
Roberts Don R and Oneill Roberts Colleen M
Current Estimated Value
Purchase Details
Closed on
Jan 3, 2011
Sold by
Ruffner Glenda
Bought by
Szabo Michael T and Szabo Angela M
Purchase Details
Closed on
Nov 23, 2009
Sold by
Ruffner Glenda
Bought by
Szabo Michael T
Purchase Details
Closed on
Dec 5, 2008
Sold by
Knopper Daniel and Ruffner Glenda
Bought by
Knopper Daniel L and The Daniel L Knopper Living Trust
Purchase Details
Closed on
Sep 21, 2007
Sold by
Prudential Relocation Inc
Bought by
Knopper Daniel
Purchase Details
Closed on
Sep 14, 2007
Sold by
Canady Marcus G and Canady Robin L
Bought by
Prudential Relocation Inc
Purchase Details
Closed on
Aug 14, 1998
Sold by
Chinavare Chinavare M M
Bought by
Canady G G and Canady L
Create a Home Valuation Report for This Property
The Home Valuation Report is an in-depth analysis detailing your home's value as well as a comparison with similar homes in the area
Home Values in the Area
Average Home Value in this Area
Purchase History
| Date | Buyer | Sale Price | Title Company |
|---|---|---|---|
| Roberts Don R | $203,000 | Minnesota Title Agency | |
| Szabo Michael T | $153,000 | Minnesota Title Agency | |
| Szabo Michael T | -- | None Available | |
| Knopper Daniel L | -- | None Available | |
| Knopper Daniel | $322,000 | Fidelity National Title | |
| Prudential Relocation Inc | $320,000 | Fidelity National Title | |
| Canady G G | $260,000 | -- |
Source: Public Records
Tax History
| Year | Tax Paid | Tax Assessment Tax Assessment Total Assessment is a certain percentage of the fair market value that is determined by local assessors to be the total taxable value of land and additions on the property. | Land | Improvement |
|---|---|---|---|---|
| 2025 | $3,253 | $213,800 | $0 | $0 |
| 2024 | $3,253 | $203,300 | $0 | $0 |
| 2023 | $3,102 | $161,200 | $0 | $0 |
| 2022 | $5,361 | $157,700 | $0 | $0 |
| 2021 | $5,197 | $145,000 | $0 | $0 |
| 2020 | $5,132 | $133,900 | $0 | $0 |
| 2019 | $4,903 | $132,500 | $0 | $0 |
| 2018 | $2,711 | $139,300 | $0 | $0 |
| 2017 | $4,062 | $142,900 | $0 | $0 |
| 2016 | $4,692 | $142,900 | $0 | $0 |
| 2015 | $11,747 | $137,400 | $0 | $0 |
| 2013 | $11,380 | $113,800 | $0 | $0 |
| 2012 | -- | $113,800 | $30,700 | $83,100 |
Source: Public Records
Map
Nearby Homes
- 27996 Waltz Rd
- 36505 Bismark Rd
- 28503 Margaret Ln Unit 1
- 26744 Canterbury Cir Unit 4
- 2131 Oakville Waltz Rd
- 26742 Canterbury Cir Unit 5
- 28450 Nieman Rd
- 36761 Willow Rd
- 37870 Cottonwood Ct Unit 3
- 0 Carleton West Rd
- 17952 Tall Oaks Ct
- 23467 Manor Rd N
- 39200 Harbor
- 23780 Carleton West Rd
- 23166 Swallow
- 0 Brandes Rd Unit 20250012383
- 0 Briar Hill Rd Unit 20261022818
- 22341 Bell Rd
- 24487 Dugan Dr
- 26700 Martinsville Rd
- 27159 Bryan Blvd
- 27162 Bryan Blvd
- 27167 Bryan Blvd
- 27156 Bryan Blvd
- 27173 Bryan Blvd Unit 25
- 37541 Leslie Dr Unit 26
- 27150 Bryan Blvd
- 27155 Bryan Blvd
- 37547 Leslie Dr
- 27147 Bryan Blvd
- 37551 Leslie Dr Unit 28
- 27141 Bryan Blvd Unit 11
- 37561 Leslie Dr
- 27171 John Dr Unit 55
- 27165 John Dr
- 27161 John Dr Unit 53
- 27137 Bryan Blvd Unit 10
- 37567 Leslie Dr
- 27157 John Dr Unit 52
- 27149 John Dr
Your Personal Tour Guide
Ask me questions while you tour the home.