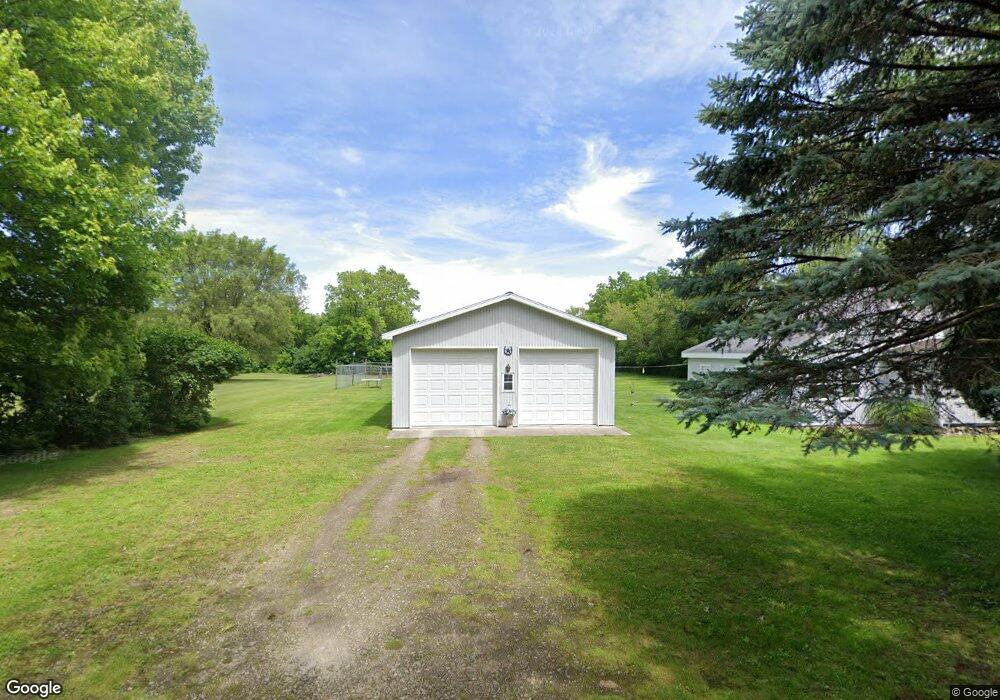
2718 Progress Rd Fremont, OH 43420
Estimated Value: $144,706 - $187,000
3
Beds
1
Bath
1,043
Sq Ft
$155/Sq Ft
Est. Value
About This Home
This home is located at 2718 Progress Rd, Fremont, OH 43420 and is currently estimated at $162,177, approximately $155 per square foot. 2718 Progress Rd is a home located in Sandusky County with nearby schools including Fremont Ross High School, St. Joseph School, and Bishop Hoffman Catholic School - This is St Joe's School now.
Ownership History
Date
Name
Owned For
Owner Type
Purchase Details
Closed on
Dec 4, 2008
Sold by
Tuckerman William M and Tuckerman Marjorie M
Bought by
Miller A Scott
Current Estimated Value
Home Financials for this Owner
Home Financials are based on the most recent Mortgage that was taken out on this home.
Original Mortgage
$61,734
Interest Rate
6.04%
Mortgage Type
Purchase Money Mortgage
Purchase Details
Closed on
Jan 1, 1993
Bought by
Miller A Scott
Create a Home Valuation Report for This Property
The Home Valuation Report is an in-depth analysis detailing your home's value as well as a comparison with similar homes in the area
Home Values in the Area
Average Home Value in this Area
Purchase History
| Date | Buyer | Sale Price | Title Company |
|---|---|---|---|
| Miller A Scott | $60,500 | None Available | |
| Miller A Scott | -- | -- |
Source: Public Records
Mortgage History
| Date | Status | Borrower | Loan Amount |
|---|---|---|---|
| Previous Owner | Miller A Scott | $61,734 |
Source: Public Records
Tax History
| Year | Tax Paid | Tax Assessment Tax Assessment Total Assessment is a certain percentage of the fair market value that is determined by local assessors to be the total taxable value of land and additions on the property. | Land | Improvement |
|---|---|---|---|---|
| 2025 | $1,066 | $110,300 | $37,500 | $72,800 |
| 2024 | $1,066 | $38,610 | $13,130 | $25,480 |
| 2023 | $1,124 | $31,400 | $10,680 | $20,720 |
| 2022 | $944 | $31,400 | $10,680 | $20,720 |
| 2021 | $972 | $31,400 | $10,680 | $20,720 |
| 2020 | $955 | $30,560 | $10,290 | $20,270 |
| 2019 | $954 | $30,560 | $10,290 | $20,270 |
| 2018 | $928 | $30,560 | $10,290 | $20,270 |
| 2017 | $876 | $29,230 | $10,290 | $18,940 |
| 2016 | $767 | $29,120 | $10,290 | $18,830 |
| 2015 | $752 | $29,120 | $10,290 | $18,830 |
| 2014 | $713 | $27,240 | $10,050 | $17,190 |
| 2013 | $698 | $27,240 | $10,050 | $17,190 |
Source: Public Records
Map
Nearby Homes
- 38 Glendale Ave
- 758 Barker Rd
- 1719 Buckland Ave
- 2242 Napoleon Rd
- 880 Cleveland Ave
- 515 Everett Rd
- 1485 Autumn Woods Dr
- 108 S Granville Blvd
- 603 Lime St
- 824 Everett Rd
- 1517 Tiffin Rd
- 1310 Mcpherson Blvd
- 1440 W Cole Rd
- 1720 Tiffin Rd
- 64 River Run Dr
- 1116 Buckland Ave
- 1128 Garrison St
- 1335 Sycamore St
- 1026 Western Ave
- 707 Franklin Ave
Your Personal Tour Guide
Ask me questions while you tour the home.