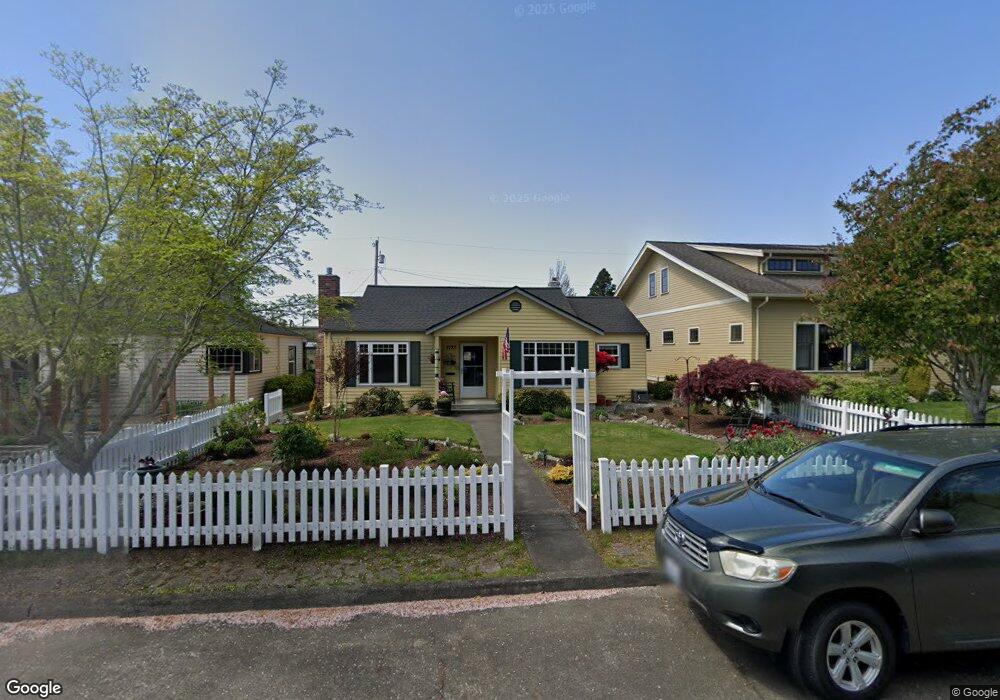
2723 Utter St Bellingham, WA 98225
Columbia NeighborhoodEstimated Value: $506,000 - $727,000
2
Beds
1
Bath
1,092
Sq Ft
$597/Sq Ft
Est. Value
About This Home
This home is located at 2723 Utter St, Bellingham, WA 98225 and is currently estimated at $652,026, approximately $597 per square foot. 2723 Utter St is a home located in Whatcom County with nearby schools including Columbia Elementary School, Whatcom Middle School, and Bellingham High School.
Ownership History
Date
Name
Owned For
Owner Type
Purchase Details
Closed on
Apr 17, 2012
Sold by
Stark Chris and Stark Traci
Bought by
Sparks Thomas H and Sparks Kathleen M
Current Estimated Value
Home Financials for this Owner
Home Financials are based on the most recent Mortgage that was taken out on this home.
Original Mortgage
$195,000
Outstanding Balance
$132,788
Interest Rate
3.84%
Mortgage Type
Purchase Money Mortgage
Estimated Equity
$519,238
Purchase Details
Closed on
Apr 27, 2009
Sold by
Sparks Kathleen M and Sparks Thomas H
Bought by
Stark Chris and Stark Traci
Home Financials for this Owner
Home Financials are based on the most recent Mortgage that was taken out on this home.
Original Mortgage
$270,019
Interest Rate
4.99%
Mortgage Type
FHA
Purchase Details
Closed on
Dec 4, 2001
Sold by
Rausch Mary Elizabeth
Bought by
Sparks Thomas H and Sparks Kathleen M
Home Financials for this Owner
Home Financials are based on the most recent Mortgage that was taken out on this home.
Original Mortgage
$107,000
Interest Rate
6.25%
Purchase Details
Closed on
Jul 7, 1999
Sold by
Blank Raymond W
Bought by
Rausch Mary Elizabeth
Create a Home Valuation Report for This Property
The Home Valuation Report is an in-depth analysis detailing your home's value as well as a comparison with similar homes in the area
Home Values in the Area
Average Home Value in this Area
Purchase History
| Date | Buyer | Sale Price | Title Company |
|---|---|---|---|
| Sparks Thomas H | $270,280 | Chicago Title Insurance | |
| Stark Chris | $275,280 | Chicago Title Insurance | |
| Sparks Thomas H | $140,000 | Whatcom Land Title | |
| Rausch Mary Elizabeth | -- | First American Title Ins Co | |
| Rausch Mary Elizabeth | -- | First American Title Ins Co |
Source: Public Records
Mortgage History
| Date | Status | Borrower | Loan Amount |
|---|---|---|---|
| Open | Sparks Thomas H | $195,000 | |
| Previous Owner | Stark Chris | $270,019 | |
| Previous Owner | Sparks Thomas H | $107,000 |
Source: Public Records
Tax History
| Year | Tax Paid | Tax Assessment Tax Assessment Total Assessment is a certain percentage of the fair market value that is determined by local assessors to be the total taxable value of land and additions on the property. | Land | Improvement |
|---|---|---|---|---|
| 2025 | $5,283 | $664,675 | $279,056 | $385,619 |
| 2024 | $5,150 | $645,315 | $270,928 | $374,387 |
| 2023 | $5,150 | $661,740 | $277,824 | $383,916 |
| 2022 | $3,823 | $570,467 | $239,504 | $330,963 |
| 2021 | $3,751 | $411,587 | $172,800 | $238,787 |
| 2020 | $3,745 | $381,099 | $160,000 | $221,099 |
| 2019 | $3,353 | $367,830 | $124,778 | $243,052 |
| 2018 | $3,377 | $330,174 | $112,028 | $218,146 |
| 2017 | $2,913 | $284,269 | $96,450 | $187,819 |
| 2016 | $2,549 | $256,349 | $86,550 | $169,799 |
| 2015 | $2,499 | $233,466 | $79,050 | $154,416 |
| 2014 | -- | $221,505 | $75,000 | $146,505 |
| 2013 | -- | $210,997 | $73,500 | $137,497 |
Source: Public Records
Map
Nearby Homes
- 2712 Victor St
- 2600 Elm St
- 2609 Jaeger St
- 2517 Peabody St
- 2404 Cherry St
- 1502 E Maplewood Ave
- 1420 E Maplewood Ave
- 2209 Eldridge Ave
- 1310 Ellsworth St
- 2836 Patton St
- 1311 Bancroft St
- 503 W Illinois St
- 1315 Astor St
- 2625 W Maplewood Ave
- 2739 Sunset Dr
- 2905 Cedarwood Ave
- 2905 Cedarwood Ave
- 1200 W Holly St
- 2709 W Maplewood Ave Unit 201
- 1011 Bancroft St Unit 204
Your Personal Tour Guide
Ask me questions while you tour the home.