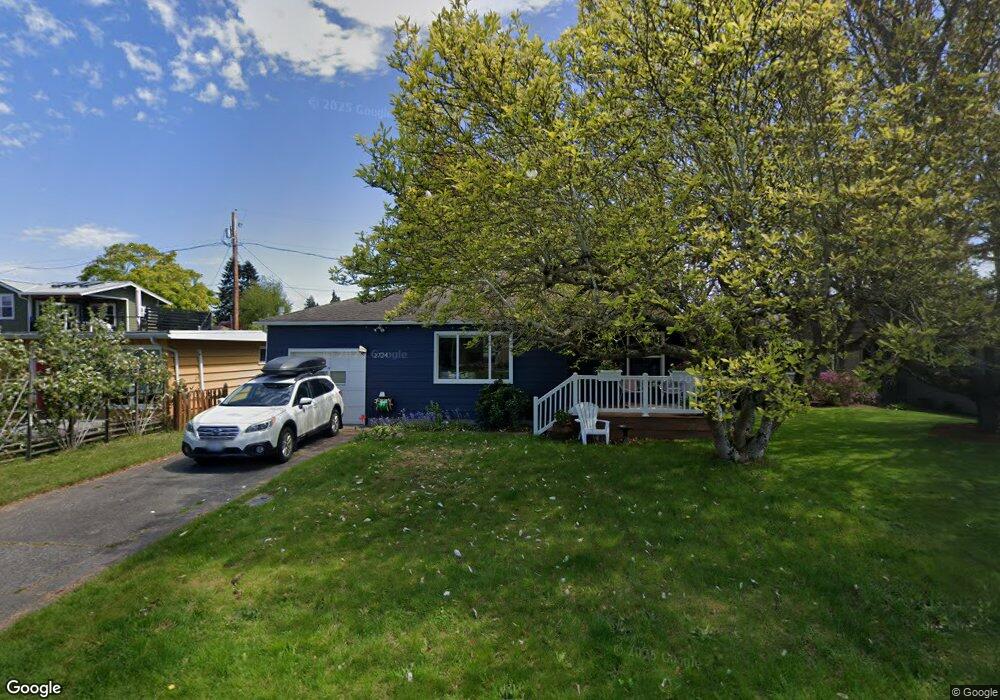
2724 Utter St Bellingham, WA 98225
Columbia NeighborhoodEstimated Value: $552,238 - $634,000
2
Beds
1
Bath
880
Sq Ft
$670/Sq Ft
Est. Value
About This Home
This home is located at 2724 Utter St, Bellingham, WA 98225 and is currently estimated at $589,810, approximately $670 per square foot. 2724 Utter St is a home located in Whatcom County with nearby schools including Columbia Elementary School, Whatcom Middle School, and Bellingham High School.
Create a Home Valuation Report for This Property
The Home Valuation Report is an in-depth analysis detailing your home's value as well as a comparison with similar homes in the area
Home Values in the Area
Average Home Value in this Area
Tax History
| Year | Tax Paid | Tax Assessment Tax Assessment Total Assessment is a certain percentage of the fair market value that is determined by local assessors to be the total taxable value of land and additions on the property. | Land | Improvement |
|---|---|---|---|---|
| 2025 | $4,195 | $527,726 | $279,056 | $248,670 |
| 2024 | $4,090 | $512,355 | $270,928 | $241,427 |
| 2023 | $4,090 | $525,396 | $277,824 | $247,572 |
| 2022 | $3,035 | $452,929 | $239,504 | $213,425 |
| 2021 | $2,978 | $326,784 | $172,800 | $153,984 |
| 2020 | $2,999 | $302,578 | $160,000 | $142,578 |
| 2019 | $2,685 | $294,499 | $124,778 | $169,721 |
| 2018 | $2,704 | $264,357 | $112,028 | $152,329 |
| 2017 | $2,331 | $227,602 | $96,450 | $131,152 |
| 2016 | $2,040 | $205,119 | $86,550 | $118,569 |
| 2015 | $2,001 | $186,877 | $79,050 | $107,827 |
| 2014 | -- | $177,303 | $75,000 | $102,303 |
| 2013 | -- | $174,229 | $73,500 | $100,729 |
Source: Public Records
Map
Nearby Homes
- 2600 Elm St
- 2609 Jaeger St
- 2517 Peabody St
- 809 W Connecticut St
- 1420 E Maplewood Ave
- 2404 Cherry St
- 1310 Ellsworth St
- 2209 Eldridge Ave
- 503 W Illinois St
- 1315 Astor St
- 2739 Sunset Dr
- 2625 W Maplewood Ave
- 1200 W Holly St
- 2905 Cedarwood Ave
- 2905 Cedarwood Ave
- 2709 W Maplewood Ave Unit 201
- 10 E St
- 9 E St
- 1011 Bancroft St Unit 204
- 1310 G St
Your Personal Tour Guide
Ask me questions while you tour the home.