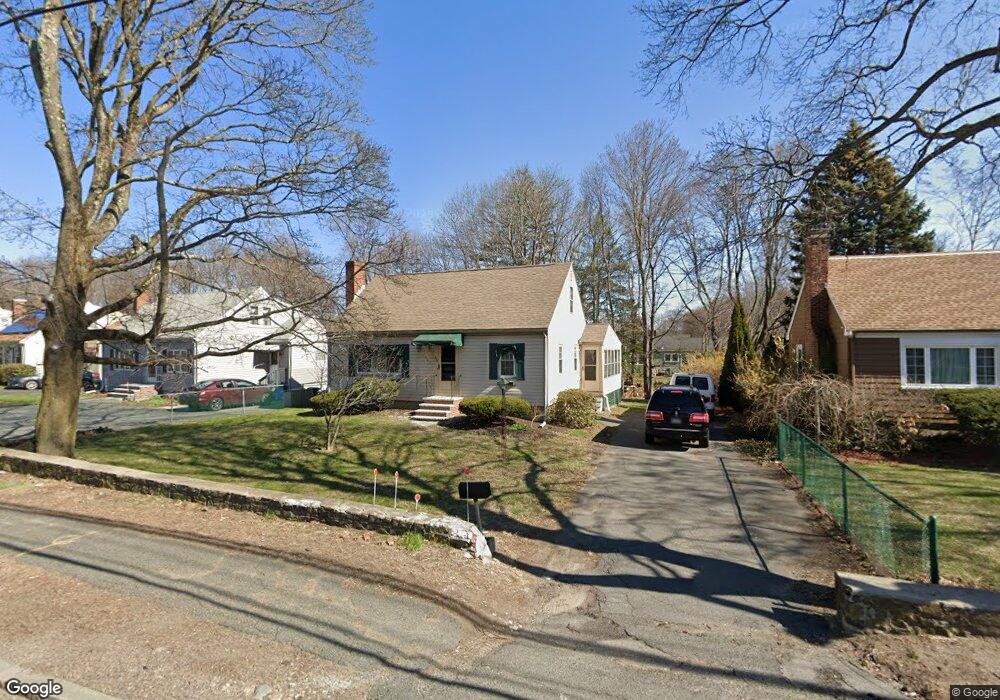
273 Main St Saugus, MA 01906
Oakland Vale NeighborhoodEstimated Value: $605,000 - $653,064
About This Home
This home is located at 273 Main St, Saugus, MA 01906 and is currently estimated at $630,516, approximately $385 per square foot. 273 Main St is a home located in Essex County with nearby schools including Saugus High School, Pioneer Charter School Of Science II, and Melrose Montessori School.
Ownership History
We collect this data history from publicly available records. To have your information removed, we recommend requesting removal directly through your county’s website.
Purchase Details
Home Financials for this Owner
Home Financials are based on the most recent Mortgage that was taken out on this home.Home Values in the Area
Average Home Value in this Area
Purchase History
We collect this data history from publicly available records. To have your information removed, we recommend requesting removal directly through your county’s website.
| Date | Buyer | Sale Price | Title Company |
|---|---|---|---|
| $320,000 | -- | ||
| $320,000 | -- | ||
| $320,000 | -- |
Mortgage History
We collect this data history from publicly available records. To have your information removed, we recommend requesting removal directly through your county’s website.
| Date | Status | Borrower | Loan Amount |
|---|---|---|---|
| Open | $75,000 | ||
| Open | $320,000 | ||
| Closed | $320,000 |
Tax History
We collect this data history from publicly available records. To have your information removed, we recommend requesting removal directly through your county’s website.
| Year | Tax Paid | Tax Assessment Tax Assessment Total Assessment is a certain percentage of the fair market value that is determined by local assessors to be the total taxable value of land and additions on the property. | Land | Improvement |
|---|---|---|---|---|
| 2025 | $5,614 | $525,700 | $292,800 | $232,900 |
| 2024 | $5,266 | $494,500 | $266,100 | $228,400 |
| 2023 | $5,155 | $457,800 | $239,500 | $218,300 |
| 2022 | $5,029 | $418,700 | $219,100 | $199,600 |
| 2021 | $4,730 | $383,300 | $190,700 | $192,600 |
| 2020 | $4,373 | $366,900 | $181,900 | $185,000 |
| 2019 | $4,187 | $343,800 | $164,100 | $179,700 |
| 2018 | $3,776 | $326,100 | $159,700 | $166,400 |
| 2017 | $3,529 | $292,900 | $149,000 | $143,900 |
| 2016 | $3,101 | $254,200 | $141,800 | $112,400 |
| 2015 | $2,911 | $242,200 | $135,100 | $107,100 |
| 2014 | $2,883 | $248,300 | $135,100 | $113,200 |
Map
- 291 Main St
- 39 Forest St
- 9 Oaklandvale Ave
- 49 Forest St
- 20 Blacksmith Way
- 216 Lynn Fells Pkwy
- 1601 Lewis o Gray Dr
- 2102 Lewis o Gray Dr
- 15 Fernwood Rd
- 2604 Lewis o Gray Dr
- 2 Heritage Ln
- 2703 Lewis o Gray Dr
- 29 Hammersmith Dr
- 12 Longwood Ave
- 9 Hammersmith Dr
- 12 Heritage Ln
- 9 Thomas St Unit 2
- 78 Hammersmith Dr
- 24 Juniper Dr
- 389 Porter St
Ask me questions while you tour the home.