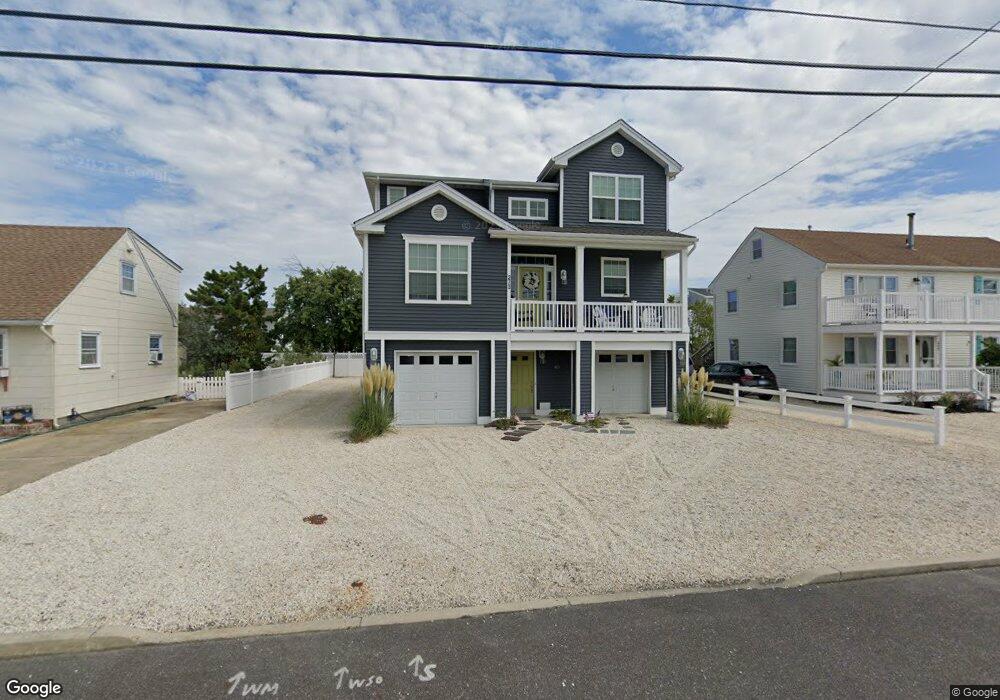
273 W 15th St Ship Bottom, NJ 08008
Long Beach Island NeighborhoodEstimated Value: $1,589,469 - $1,751,000
About This Home
This home is located at 273 W 15th St, Ship Bottom, NJ 08008 and is currently estimated at $1,682,617, approximately $847 per square foot. 273 W 15th St is a home located in Ocean County with nearby schools including Ethel A. Jacobsen Elementary School, Long Beach Island Grade School, and Southern Regional Middle School.
Ownership History
We collect this data history from publicly available records. To have your information removed, we recommend requesting removal directly through your county’s website.
Purchase Details
Home Financials for this Owner
Home Financials are based on the most recent Mortgage that was taken out on this home.Home Values in the Area
Average Home Value in this Area
Purchase History
We collect this data history from publicly available records. To have your information removed, we recommend requesting removal directly through your county’s website.
| Date | Buyer | Sale Price | Title Company |
|---|---|---|---|
| $277,500 | -- |
Mortgage History
We collect this data history from publicly available records. To have your information removed, we recommend requesting removal directly through your county’s website.
| Date | Status | Borrower | Loan Amount |
|---|---|---|---|
| Open | $277,500 |
Tax History
We collect this data history from publicly available records. To have your information removed, we recommend requesting removal directly through your county’s website.
| Year | Tax Paid | Tax Assessment Tax Assessment Total Assessment is a certain percentage of the fair market value that is determined by local assessors to be the total taxable value of land and additions on the property. | Land | Improvement |
|---|---|---|---|---|
| 2025 | $9,585 | $772,400 | $350,000 | $422,400 |
| 2024 | $8,875 | $772,400 | $350,000 | $422,400 |
| 2023 | $8,180 | $772,400 | $350,000 | $422,400 |
| 2022 | $8,180 | $772,400 | $350,000 | $422,400 |
| 2021 | $8,141 | $772,400 | $350,000 | $422,400 |
| 2020 | $8,164 | $772,400 | $350,000 | $422,400 |
| 2019 | $8,172 | $772,400 | $350,000 | $422,400 |
| 2018 | $8,187 | $772,400 | $350,000 | $422,400 |
| 2017 | $3,469 | $350,000 | $350,000 | $0 |
| 2016 | $5,139 | $464,200 | $295,000 | $169,200 |
| 2015 | $5,013 | $464,200 | $295,000 | $169,200 |
| 2014 | $5,009 | $464,200 | $295,000 | $169,200 |
Map
- 280 W 15th St
- 301 W 18th St
- 354 W 11th St
- 213 W 13th St
- 351 W 10th St
- 108 W 10th St
- 11 4th St
- 1219 Long Beach Blvd
- 2572 E East Bay Ave
- 111 E 22nd St
- 2561 2nd St
- 401 Boulevard Unit 306
- 401 Boulevard Unit 405
- 401 Boulevard Unit 503
- 401 Boulevard Unit 207
- 22 Manning Dr
- 310 Central Ave
- 326 S 2nd St
- 106 E 25th St
- 106 W 26th St
- 1411 Barnegat Ave
- 1419 Barnegat Ave
- 303 W 15th St
- 1401 Barnegat Ave
- 1401 Barnegat Ave
- 304 W 14th St
- 307 W 15th St
- 310 W 14th St
- 1412 Barnegat Ave
- 1402 Barnegat Ave
- 1402 Barnegat Ave
- 1420 Barnegat Ave
- 315 W 15th St
- 316 W 14th St
- 1505 Barnegat Ave
- 304 W 15th St
- 303 W 14th St
- 1502 Barnegat Ave
- 306 W 15th St
- 1315 Barnegat Ave
Ask me questions while you tour the home.