273 Wolf Rd Sublette, IL 61367
Estimated Value: $203,000 - $305,000
Studio
1
Bath
1,248
Sq Ft
$188/Sq Ft
Est. Value
About This Home
This home is located at 273 Wolf Rd, Sublette, IL 61367 and is currently estimated at $234,253, approximately $187 per square foot. 273 Wolf Rd is a home located in Lee County with nearby schools including Amboy Central Elementary School, Amboy Junior High School, and Amboy High School.
Ownership History
Date
Name
Owned For
Owner Type
Purchase Details
Closed on
Jan 16, 2026
Sold by
Schammel Douglas L and Schammel Karen J
Bought by
Spitz Teri and Heiden Kimberly
Current Estimated Value
Create a Home Valuation Report for This Property
The Home Valuation Report is an in-depth analysis detailing your home's value as well as a comparison with similar homes in the area
Purchase History
| Date | Buyer | Sale Price | Title Company |
|---|---|---|---|
| Spitz Teri | -- | None Available |
Source: Public Records
Tax History
| Year | Tax Paid | Tax Assessment Tax Assessment Total Assessment is a certain percentage of the fair market value that is determined by local assessors to be the total taxable value of land and additions on the property. | Land | Improvement |
|---|---|---|---|---|
| 2024 | $3,265 | $58,648 | $6,362 | $52,286 |
| 2023 | $2,959 | $55,855 | $6,059 | $49,796 |
| 2022 | $2,959 | $51,243 | $5,559 | $45,684 |
| 2021 | $2,686 | $47,091 | $4,833 | $42,258 |
| 2020 | $2,633 | $45,719 | $4,692 | $41,027 |
| 2019 | $2,624 | $44,387 | $4,555 | $39,832 |
| 2018 | $2,493 | $42,273 | $4,338 | $37,935 |
| 2017 | $2,238 | $42,273 | $3,781 | $38,492 |
| 2016 | $2,225 | $42,273 | $3,781 | $38,492 |
| 2015 | $2,222 | $42,273 | $3,781 | $38,492 |
| 2014 | $2,213 | $42,273 | $3,781 | $38,492 |
| 2013 | $2,506 | $47,034 | $3,491 | $43,543 |
Source: Public Records
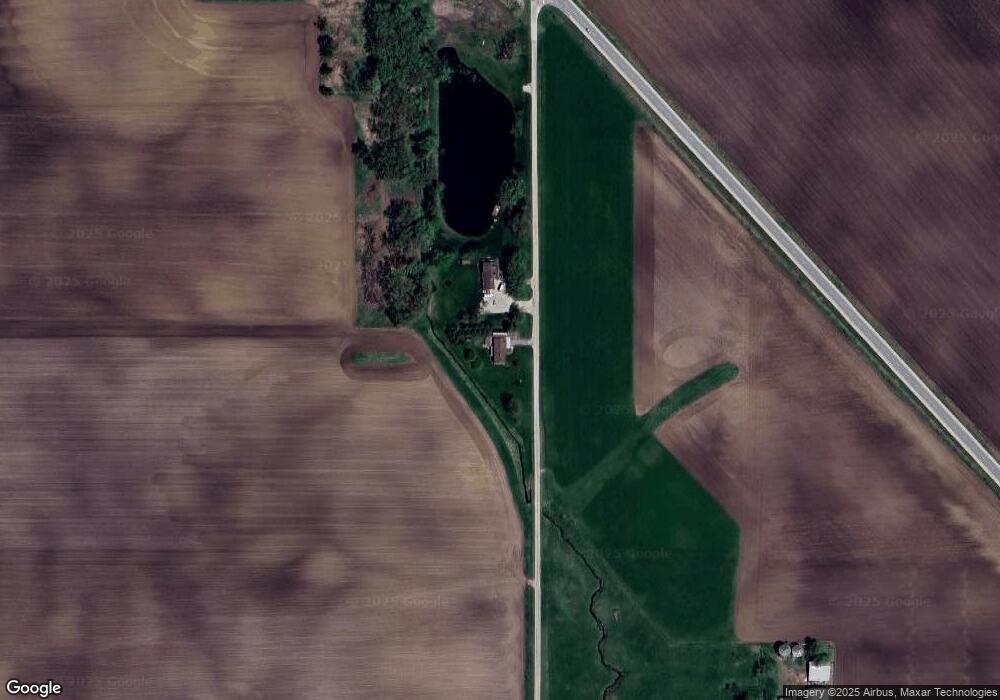
Map
Nearby Homes
- 100 W 3rd St
- 302 S John St
- 11/113 Woodhaven
- 22-46 Woodhaven Lakes
- 21-229 Woodhaven Lakes
- 21-79 Woodhaven Lake
- 5/371 Woodhaven
- 9-128 Woodhaven Lakes
- 21-54 Woodhaven Lakes Dr
- 18-29 Woodhaven Lakes
- 11/167 Woodhaven
- 24/141 Woodhaven
- 15-98 Woodhaven Lakes
- 6-126 Woodhaven Lakes
- 9-49 Woodhaven Lakes
- 13-100 Woodhaven Lakes
- 3-166 Woodhaven Lakes
- 26-204 Woodhaven Lakes
- 2-148 Woodhaven Lakes
- 4-152 Woodhaven Lakes
Your Personal Tour Guide
Ask me questions while you tour the home.