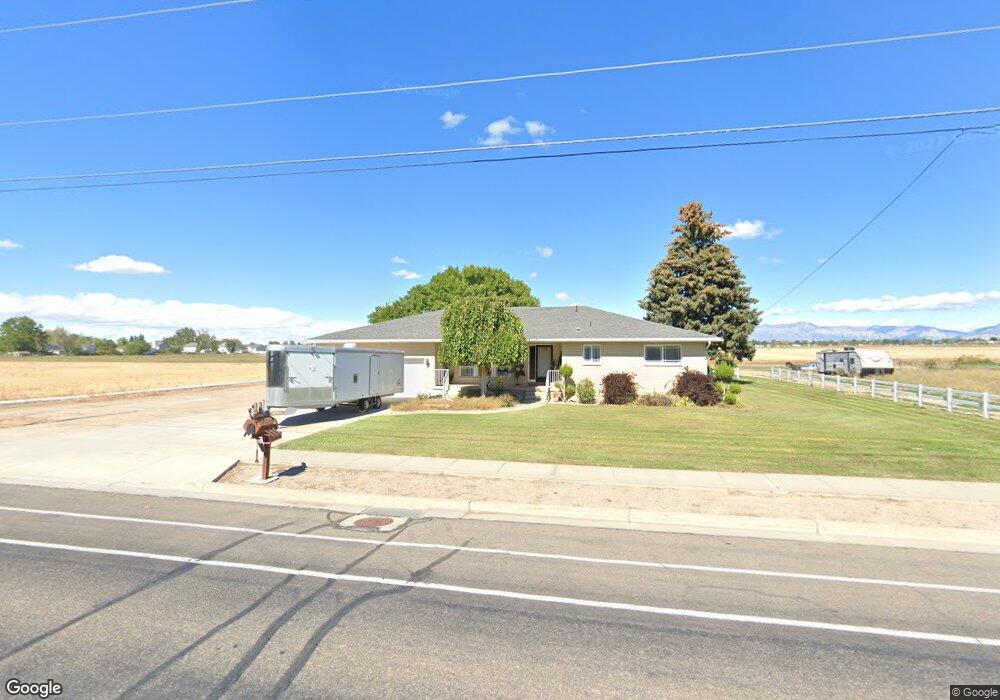
2732 W 700 S Syracuse, UT 84075
Estimated Value: $635,000 - $701,000
3
Beds
3
Baths
2,004
Sq Ft
$334/Sq Ft
Est. Value
About This Home
This home is located at 2732 W 700 S, Syracuse, UT 84075 and is currently estimated at $668,918, approximately $333 per square foot. 2732 W 700 S is a home located in Davis County with nearby schools including Syracuse Elementary School, Syracuse Junior High School, and Syracuse High School.
Ownership History
Date
Name
Owned For
Owner Type
Purchase Details
Closed on
Mar 4, 2008
Sold by
Crandall Craig Matthew
Bought by
Clark Jack M
Current Estimated Value
Home Financials for this Owner
Home Financials are based on the most recent Mortgage that was taken out on this home.
Original Mortgage
$286,045
Outstanding Balance
$174,204
Interest Rate
5.41%
Mortgage Type
Purchase Money Mortgage
Estimated Equity
$494,714
Purchase Details
Closed on
Jun 17, 2002
Sold by
Knight Blake H and Knight Merle C
Bought by
Crandall Jay W
Create a Home Valuation Report for This Property
The Home Valuation Report is an in-depth analysis detailing your home's value as well as a comparison with similar homes in the area
Home Values in the Area
Average Home Value in this Area
Purchase History
| Date | Buyer | Sale Price | Title Company |
|---|---|---|---|
| Clark Jack M | -- | Founders Title Co Layton | |
| Crandall Jay W | -- | Founders Title Company |
Source: Public Records
Mortgage History
| Date | Status | Borrower | Loan Amount |
|---|---|---|---|
| Open | Clark Jack M | $286,045 |
Source: Public Records
Tax History
| Year | Tax Paid | Tax Assessment Tax Assessment Total Assessment is a certain percentage of the fair market value that is determined by local assessors to be the total taxable value of land and additions on the property. | Land | Improvement |
|---|---|---|---|---|
| 2025 | $3,303 | $318,634 | $152,682 | $165,952 |
| 2024 | $3,168 | $307,746 | $149,609 | $158,137 |
| 2023 | $2,998 | $506,000 | $238,883 | $267,117 |
| 2022 | $3,161 | $290,400 | $135,952 | $154,448 |
| 2021 | $2,774 | $391,000 | $206,180 | $184,820 |
| 2020 | $2,489 | $341,000 | $163,529 | $177,471 |
| 2019 | $2,449 | $323,000 | $175,817 | $147,183 |
| 2018 | $2,285 | $299,000 | $158,495 | $140,505 |
| 2016 | $2,007 | $150,013 | $64,923 | $85,090 |
| 2015 | $1,944 | $138,364 | $64,826 | $73,538 |
| 2014 | $2,153 | $156,171 | $61,246 | $94,925 |
| 2013 | -- | $117,449 | $60,713 | $56,736 |
Source: Public Records
Map
Nearby Homes
- 2885 W 700 S
- 160 S 2775 W
- 4205 W 1100 S
- 2935 W 1200 S
- 2809 W 100 S
- 2584 S 2430 St W Unit 502
- 2613 S 2430 W Unit 111
- 2614 S 2430 W Unit 106
- 2665 S 2430 W Unit 118
- 2663 S 2430 W
- 2098 W 700 S
- 82 N 2875 W
- 114 N 2825 W
- 380 S 4300 W Unit 608
- 4200 W 800 N
- 39 S 2000 W
- 1441 Brookshire Dr
- 1932 W 200 S
- 2429 W 300 N
- 12 N 2000 W Unit 1
Your Personal Tour Guide
Ask me questions while you tour the home.