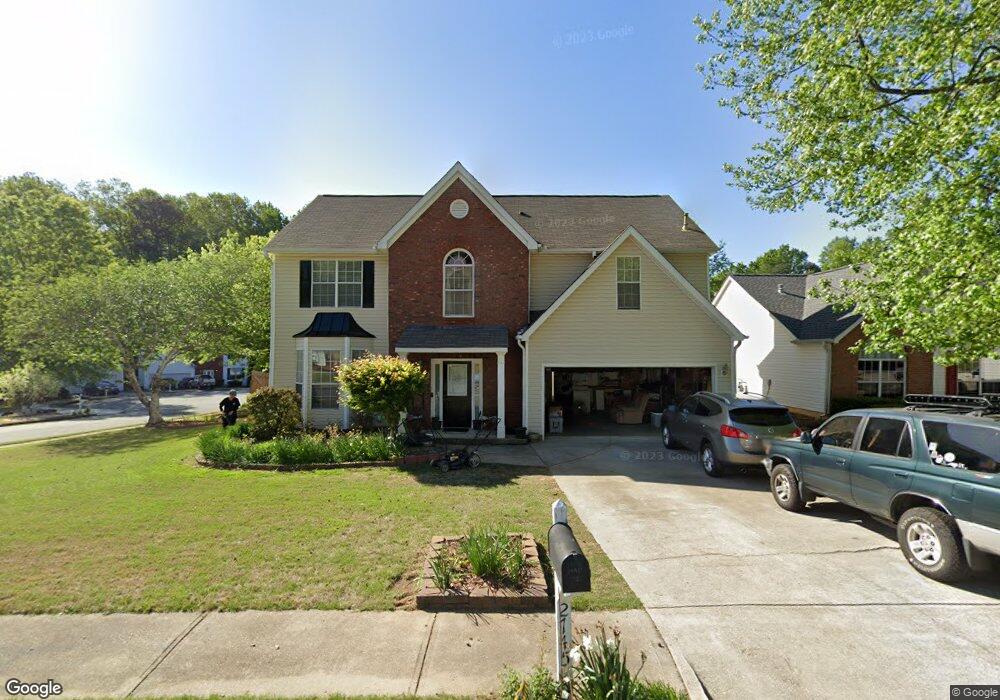
2745 Nesbitt Crossing Way Unit 1 Duluth, GA 30096
Estimated Value: $465,000 - $518,000
4
Beds
3
Baths
2,420
Sq Ft
$204/Sq Ft
Est. Value
About This Home
This home is located at 2745 Nesbitt Crossing Way Unit 1, Duluth, GA 30096 and is currently estimated at $494,394, approximately $204 per square foot. 2745 Nesbitt Crossing Way Unit 1 is a home located in Gwinnett County with nearby schools including Chattahoochee Elementary School, Coleman Middle School, and Duluth High School.
Ownership History
Date
Name
Owned For
Owner Type
Purchase Details
Closed on
Mar 18, 2025
Sold by
Bounthavalang Nyny
Bought by
Bounthavalang Nyny and Kenphila Bouavanh
Current Estimated Value
Home Financials for this Owner
Home Financials are based on the most recent Mortgage that was taken out on this home.
Original Mortgage
$283,800
Interest Rate
6.91%
Mortgage Type
New Conventional
Purchase Details
Closed on
Jan 31, 2025
Sold by
Kenphila Bouavanh
Bought by
Bounthavalang Nyny and Noyphao Evelyn Tou
Home Financials for this Owner
Home Financials are based on the most recent Mortgage that was taken out on this home.
Original Mortgage
$283,800
Interest Rate
6.91%
Mortgage Type
New Conventional
Purchase Details
Closed on
May 28, 1997
Sold by
Castle Homes Inc
Bought by
Phakdyrattana Smeate and Phakdyrattana Bouavanh K
Home Financials for this Owner
Home Financials are based on the most recent Mortgage that was taken out on this home.
Original Mortgage
$111,300
Interest Rate
7.93%
Mortgage Type
New Conventional
Create a Home Valuation Report for This Property
The Home Valuation Report is an in-depth analysis detailing your home's value as well as a comparison with similar homes in the area
Home Values in the Area
Average Home Value in this Area
Purchase History
| Date | Buyer | Sale Price | Title Company |
|---|---|---|---|
| Bounthavalang Nyny | -- | -- | |
| Bounthavalang Nyny | $473,000 | -- | |
| Phakdyrattana Smeate | $139,200 | -- |
Source: Public Records
Mortgage History
| Date | Status | Borrower | Loan Amount |
|---|---|---|---|
| Previous Owner | Bounthavalang Nyny | $283,800 | |
| Previous Owner | Phakdyrattana Smeate | $111,300 |
Source: Public Records
Tax History
| Year | Tax Paid | Tax Assessment Tax Assessment Total Assessment is a certain percentage of the fair market value that is determined by local assessors to be the total taxable value of land and additions on the property. | Land | Improvement |
|---|---|---|---|---|
| 2025 | $1,237 | $192,320 | $29,920 | $162,400 |
| 2024 | $714 | $179,080 | $32,400 | $146,680 |
| 2023 | $714 | $194,600 | $32,400 | $162,200 |
| 2022 | $714 | $161,920 | $26,000 | $135,920 |
| 2021 | $3,227 | $121,360 | $20,000 | $101,360 |
| 2020 | $3,257 | $121,360 | $20,000 | $101,360 |
| 2019 | $3,898 | $114,360 | $16,000 | $98,360 |
| 2018 | $2,878 | $103,400 | $16,000 | $87,400 |
| 2016 | $2,609 | $90,880 | $16,000 | $74,880 |
| 2015 | $3,206 | $90,880 | $16,000 | $74,880 |
| 2014 | $2,300 | $74,800 | $12,400 | $62,400 |
Source: Public Records
Map
Nearby Homes
- 3590 North St
- 3592 North St
- 2731 Pine Cone Ln
- 3106 Moor View Rd
- 2605 River Summit Dr
- 3711 Thornbrooke Ct
- 3325 River Summit Trail
- 2582 Kenwood Dr Unit 3
- 2988 First St
- 3875 Stonebriar Ct
- 2825 Pine St
- 3614 Clearbrooke Way
- 2711 Old Coach Rd
- 3607 W Lawrenceville St
- 3132 Hill St NW Unit 1
- 2629 Kensington Dr
- 3334 Swallowtail Terrace
- 2915 Pine St
- 2703 Heath Ln Unit 1
- 3207 Hill St
- 2735 Nesbitt Crossing Way
- 3563 Nesbitt Crossing Cir
- 2675 Nesbitt Crossing Way Unit 1
- 2655 Nesbitt Crossing Way Unit 1
- 3573 Nesbitt Crossing Cir Unit 1
- 3558 Nesbitt Crossing Cir Unit 1
- 2740 Nesbitt Crossing Way Unit 1
- 2750 Nesbitt Crossing Way
- 2730 Nesbitt Crossing Way
- 2730 Nesbitt Crossing Way
- 2750 Nesbitt Crossing
- 3568 Nesbitt Crossing Cir Unit 1
- 2645 Nesbitt Crossing Way Unit 1
- 2760 Nesbitt Crossing Way
- 2635 Nesbitt Crossing Way
- 2770 Nesbitt Crossing Way
- 3578 Nesbitt Crossing Cir Unit 1
- 3583 Nesbitt Crossing Cir Unit 1
- 2710 Nesbitt Crossing Way
- 3588 Nesbitt Crossing Cir Unit 1
Your Personal Tour Guide
Ask me questions while you tour the home.