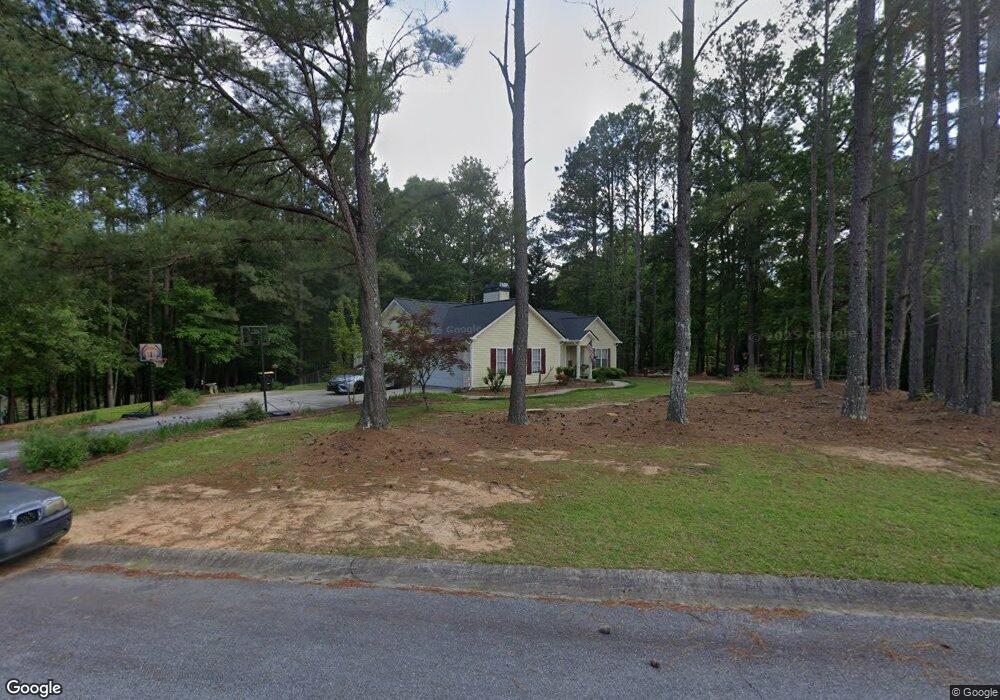
275 Paces Landing Trace Newnan, GA 30263
Estimated Value: $295,565 - $331,000
3
Beds
2
Baths
1,367
Sq Ft
$229/Sq Ft
Est. Value
About This Home
This home is located at 275 Paces Landing Trace, Newnan, GA 30263 and is currently estimated at $313,641, approximately $229 per square foot. 275 Paces Landing Trace is a home located in Coweta County with nearby schools including Brooks Elementary School, Madras Middle School, and Northgate High School.
Ownership History
Date
Name
Owned For
Owner Type
Purchase Details
Closed on
Aug 7, 2007
Sold by
Bryan Stepen R
Bought by
Johnson Cindy D
Current Estimated Value
Home Financials for this Owner
Home Financials are based on the most recent Mortgage that was taken out on this home.
Original Mortgage
$155,000
Outstanding Balance
$97,637
Interest Rate
6.65%
Mortgage Type
New Conventional
Estimated Equity
$216,004
Purchase Details
Closed on
Oct 9, 1998
Bought by
Bryan Stephen R
Purchase Details
Closed on
Sep 7, 1994
Bought by
Richard E Perry Home
Purchase Details
Closed on
Aug 26, 1993
Bought by
Evergreen Communitie
Purchase Details
Closed on
Jul 31, 1978
Bought by
Francavilla Carl and Francavilla J
Create a Home Valuation Report for This Property
The Home Valuation Report is an in-depth analysis detailing your home's value as well as a comparison with similar homes in the area
Purchase History
| Date | Buyer | Sale Price | Title Company |
|---|---|---|---|
| Johnson Cindy D | $155,000 | -- | |
| Bryan Stephen R | -- | -- | |
| Richard E Perry Home | $49,200 | -- | |
| Evergreen Communitie | $268,900 | -- | |
| Francavilla Carl | -- | -- |
Source: Public Records
Mortgage History
| Date | Status | Borrower | Loan Amount |
|---|---|---|---|
| Open | Johnson Cindy D | $155,000 |
Source: Public Records
Tax History
| Year | Tax Paid | Tax Assessment Tax Assessment Total Assessment is a certain percentage of the fair market value that is determined by local assessors to be the total taxable value of land and additions on the property. | Land | Improvement |
|---|---|---|---|---|
| 2025 | $2,386 | $107,360 | $22,000 | $85,360 |
| 2024 | $2,287 | $103,122 | $22,000 | $81,122 |
| 2023 | $2,287 | $95,735 | $22,000 | $73,735 |
Source: Public Records
Map
Nearby Homes
- 326 Atlantica Dr
- 331 Atlantica Dr
- 51 Conifer Ct Unit 71
- 280 Atlantica Dr Unit 45
- 127 Atlantica Dr Unit 86
- 17 Hedge Ct
- 128 Atlantica Dr Unit 30
- 15 Ingram Ct
- 8 Ranan Ln
- 255 Hillbrook Chase
- 178 Dakotahs Bend
- 95 Renkin Way
- 3286 Happy Valley Cir Unit LOT 1
- 3230 Happy Valley Cir Unit LOT 3
- 140 Quiet Cove Unit LOT 46
- 65 S Shore Dr
- 374 S Alexander Creek Rd
- 420 Lamar Smith Dr Unit LOT 12
- 394 S Alexander Creek Rd
- 100 S Shore Dr
- 285 Paces Landing Trace
- 104 Paces Landing Way
- 127 Paces Landing Way
- 150 Paces Landing Way
- 157 Paces Landing Way
- 111 Paces Landing Way
- 295 Paces Landing Trace
- 239 Paces Landing Trace
- 88 Paces Landing Way
- 296 Paces Landing Trace
- 224 Paces Landing Trace
- 223 Paces Landing Trace
- 72 Paces Landing Way
- 91 Paces Landing Way
- 70 Paces Landing Way
- 77 Paces Landing Way
- 69 Paces Landing Way
- 69 Paces Landing Way
- 69 Paces Landing Way
- 207 Paces Landing Way
Your Personal Tour Guide
Ask me questions while you tour the home.