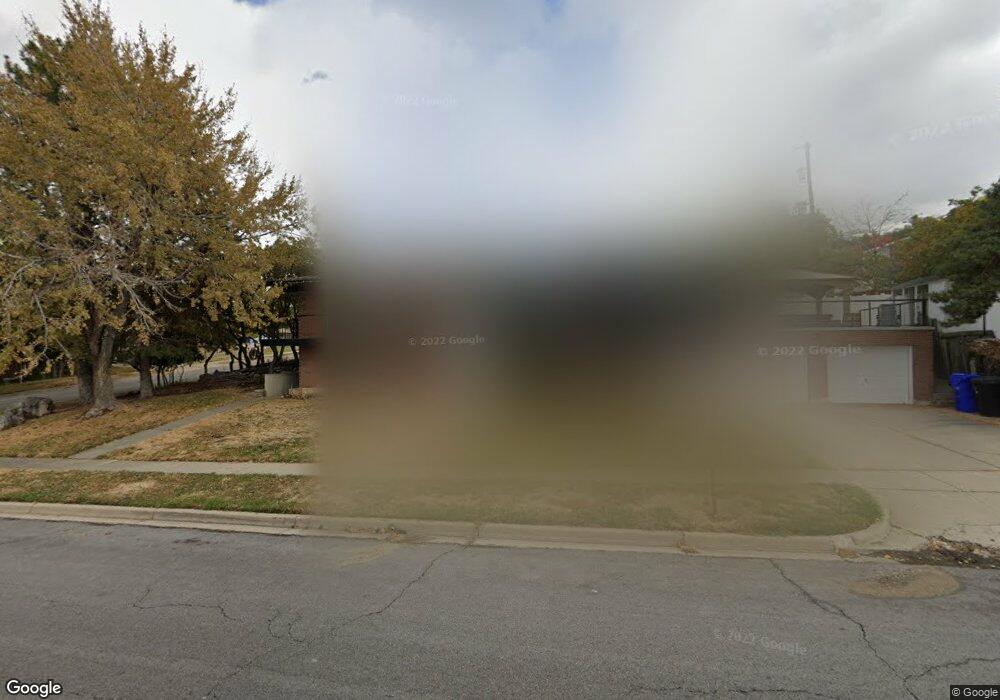
2763 S 400 E Bountiful, UT 84010
Estimated Value: $627,000 - $645,000
4
Beds
3
Baths
1,690
Sq Ft
$376/Sq Ft
Est. Value
About This Home
This home is located at 2763 S 400 E, Bountiful, UT 84010 and is currently estimated at $636,022, approximately $376 per square foot. 2763 S 400 E is a home located in Davis County with nearby schools including Muir School, Mueller Park Junior High School, and Woods Cross High School.
Ownership History
Date
Name
Owned For
Owner Type
Purchase Details
Closed on
Dec 19, 2014
Sold by
Harker Tyler J
Bought by
Harker Tyler J and Harker Heidi
Current Estimated Value
Purchase Details
Closed on
Apr 13, 2009
Sold by
Baker Betty O
Bought by
Baker Betty R
Create a Home Valuation Report for This Property
The Home Valuation Report is an in-depth analysis detailing your home's value as well as a comparison with similar homes in the area
Purchase History
| Date | Buyer | Sale Price | Title Company |
|---|---|---|---|
| Harker Tyler J | -- | First American Title | |
| Harker Tyler J | -- | First American Title | |
| Baker Betty R | -- | None Available |
Source: Public Records
Tax History
| Year | Tax Paid | Tax Assessment Tax Assessment Total Assessment is a certain percentage of the fair market value that is determined by local assessors to be the total taxable value of land and additions on the property. | Land | Improvement |
|---|---|---|---|---|
| 2025 | $3,610 | $331,100 | $133,245 | $197,855 |
| 2024 | $3,337 | $316,250 | $122,861 | $193,389 |
| 2023 | $3,206 | $551,000 | $222,641 | $328,359 |
| 2022 | $3,201 | $301,400 | $118,536 | $182,864 |
| 2021 | $2,947 | $425,000 | $176,168 | $248,832 |
| 2020 | $2,612 | $378,000 | $160,413 | $217,587 |
| 2019 | $2,638 | $373,000 | $158,304 | $214,696 |
| 2018 | $2,425 | $337,000 | $147,017 | $189,983 |
| 2016 | $2,067 | $148,500 | $46,830 | $101,670 |
| 2015 | $2,102 | $149,600 | $46,830 | $102,770 |
| 2014 | $1,891 | $137,504 | $46,830 | $90,674 |
| 2013 | -- | $130,967 | $48,014 | $82,953 |
Source: Public Records
Map
Nearby Homes
- 610 Meadowlark Ln
- 438 Indian Springs Rd
- 2292 S 250 E
- 69 E North Canyon Rd
- 424 E Canyon Estates Dr S
- 2273 S 200 E
- 19 E North Canyon Rd
- 761 San Simeon Way
- 320 E 2100 S
- 110 2250 S
- 831 E San Simeon Way S
- 2053 S 350 E Unit 7
- 2046 S 350 E Unit 4
- 295 E 2050 S Unit 1
- 296 E 2050 S Unit 2
- 2038 S 350 E Unit 3
- 2059 S 350 E Unit 6
- 188 E 2050 S Unit D3
- 2136 S 900 E
- 41 E 2200 S
Your Personal Tour Guide
Ask me questions while you tour the home.