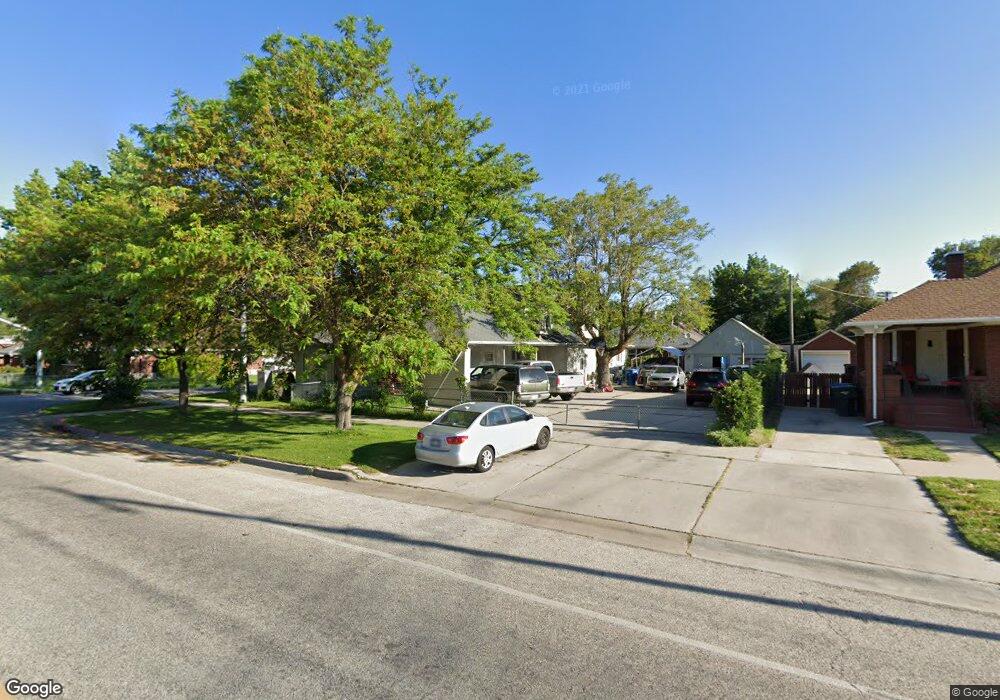
2776 Monroe Blvd Ogden, UT 84403
TO Smith NeighborhoodEstimated Value: $483,000 - $542,000
3
Beds
2
Baths
4,450
Sq Ft
$114/Sq Ft
Est. Value
About This Home
This home is located at 2776 Monroe Blvd, Ogden, UT 84403 and is currently estimated at $506,648, approximately $113 per square foot. 2776 Monroe Blvd is a home located in Weber County with nearby schools including Polk School, Mound Fort Junior High School, and Ogden High School.
Ownership History
Date
Name
Owned For
Owner Type
Purchase Details
Closed on
Sep 28, 2010
Sold by
Aparicio Angel and Aparicio Graciela
Bought by
Aparicio Graciela and Aparicio Angel
Current Estimated Value
Home Financials for this Owner
Home Financials are based on the most recent Mortgage that was taken out on this home.
Original Mortgage
$105,000
Interest Rate
4.35%
Mortgage Type
New Conventional
Purchase Details
Closed on
Jul 15, 1998
Sold by
Taylor Gary L
Bought by
Aparicio Angel and Aparicio Graciela
Home Financials for this Owner
Home Financials are based on the most recent Mortgage that was taken out on this home.
Original Mortgage
$99,489
Interest Rate
7%
Mortgage Type
FHA
Purchase Details
Closed on
Dec 26, 1997
Sold by
Eccles Vera E and Eccles John D
Bought by
Taylor Gary L
Purchase Details
Closed on
Dec 12, 1996
Sold by
Eccles Vera E
Bought by
Taylor Gary L
Create a Home Valuation Report for This Property
The Home Valuation Report is an in-depth analysis detailing your home's value as well as a comparison with similar homes in the area
Home Values in the Area
Average Home Value in this Area
Purchase History
| Date | Buyer | Sale Price | Title Company |
|---|---|---|---|
| Aparicio Graciela | -- | Weber Title | |
| Aparicio Angel | -- | U S Title | |
| Taylor Gary L | -- | U S Title | |
| Taylor Gary L | -- | U S Title | |
| Taylor Gary L | -- | Security Title |
Source: Public Records
Mortgage History
| Date | Status | Borrower | Loan Amount |
|---|---|---|---|
| Closed | Aparicio Graciela | $105,000 | |
| Closed | Aparicio Angel | $99,489 |
Source: Public Records
Tax History
| Year | Tax Paid | Tax Assessment Tax Assessment Total Assessment is a certain percentage of the fair market value that is determined by local assessors to be the total taxable value of land and additions on the property. | Land | Improvement |
|---|---|---|---|---|
| 2025 | $3,226 | $472,953 | $95,141 | $377,812 |
| 2024 | $3,168 | $250,798 | $52,327 | $198,471 |
| 2023 | $2,968 | $236,500 | $48,748 | $187,752 |
| 2022 | $3,394 | $271,150 | $41,730 | $229,420 |
| 2021 | $2,723 | $361,000 | $50,139 | $310,861 |
| 2020 | $2,498 | $306,000 | $28,088 | $277,912 |
| 2019 | $2,400 | $276,000 | $28,088 | $247,912 |
| 2018 | $2,126 | $243,001 | $26,379 | $216,622 |
| 2017 | $2,507 | $243,000 | $51,983 | $191,017 |
| 2016 | $2,546 | $146,885 | $42,179 | $104,706 |
| 2015 | $2,609 | $146,885 | $40,958 | $105,927 |
| 2014 | $2,614 | $144,523 | $33,211 | $111,312 |
Source: Public Records
Map
Nearby Homes
Your Personal Tour Guide
Ask me questions while you tour the home.