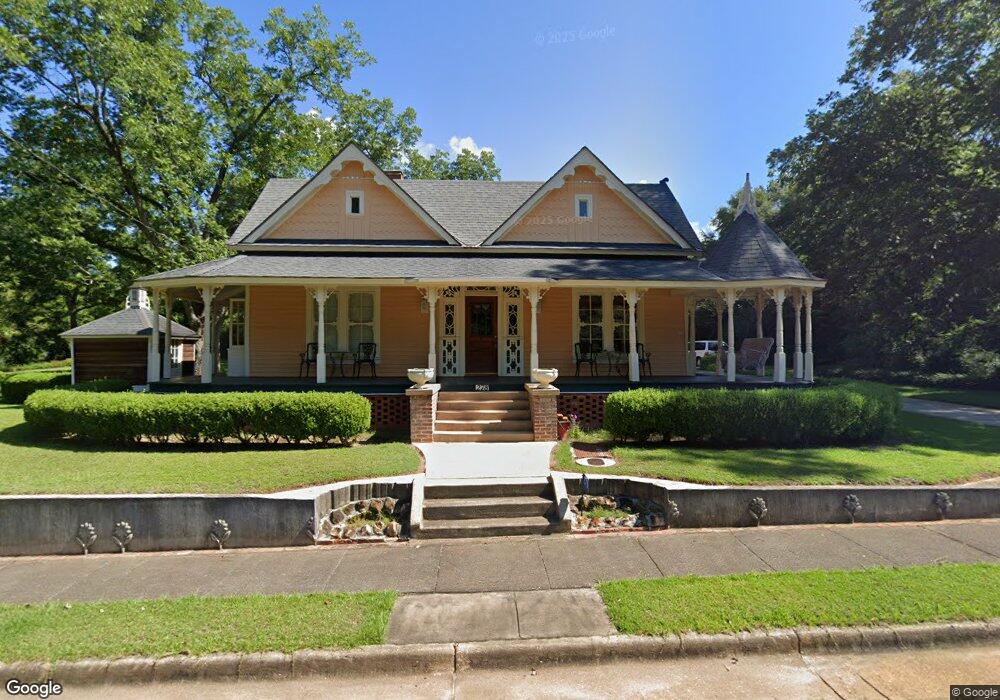
278 E Main St Parrott, GA 39877
Estimated Value: $79,222 - $208,000
3
Beds
1
Bath
1,588
Sq Ft
$83/Sq Ft
Est. Value
About This Home
This home is located at 278 E Main St, Parrott, GA 39877 and is currently estimated at $131,056, approximately $82 per square foot. 278 E Main St is a home located in Terrell County with nearby schools including Cooper-Carver Elementary School, Terrell Middle School, and Terrell High School.
Create a Home Valuation Report for This Property
The Home Valuation Report is an in-depth analysis detailing your home's value as well as a comparison with similar homes in the area
Home Values in the Area
Average Home Value in this Area
Tax History
| Year | Tax Paid | Tax Assessment Tax Assessment Total Assessment is a certain percentage of the fair market value that is determined by local assessors to be the total taxable value of land and additions on the property. | Land | Improvement |
|---|---|---|---|---|
| 2025 | $950 | $23,781 | $2,400 | $21,381 |
| 2024 | $903 | $23,781 | $2,400 | $21,381 |
| 2023 | $903 | $23,781 | $2,400 | $21,381 |
| 2022 | $737 | $23,781 | $2,400 | $21,381 |
| 2021 | $737 | $23,781 | $2,400 | $21,381 |
| 2020 | $737 | $23,781 | $2,400 | $21,381 |
| 2019 | $713 | $23,781 | $2,400 | $21,381 |
| 2018 | $713 | $23,781 | $2,400 | $21,381 |
| 2017 | $832 | $23,781 | $2,400 | $21,381 |
| 2016 | $713 | $23,781 | $2,400 | $21,381 |
| 2015 | -- | $23,781 | $2,400 | $21,381 |
| 2014 | -- | $23,781 | $2,400 | $21,381 |
| 2013 | -- | $23,781 | $2,400 | $21,381 |
Source: Public Records
Map
Nearby Homes
- 109 Main St
- 318 Church St
- 128 College St NE
- 0 Main St
- Pritchard Pond Rd
- 137 College St NE
- 4 Georgia 520
- 162 College St SW
- 161 College St
- 0 Kennedy Pond Rd Unit 26349109
- 0 Kennedy Pond Rd Unit 10694803
- 1 Harrell Rd
- 1472 Harrell Rd
- 2 Harrell Rd
- 3 Harrell Rd
- 5 Pear Orchard Rd
- XX1 Columbus Hwy
- 3176 E Centerpoint Rd
- 2055 Payne Pond Rd
- 1075 Cox Rd
- 262 E Main St
- 271 E Main St
- 295 Church St NE
- 109 Preston Rd SE
- 3399 Pearl
- 333 Ascot Way
- 220 E Main St
- 102 Preston Rd SE
- 128 Preston Rd SE
- 234 Church St NE
- 245 Church St NE
- 525 King St
- 241 Huckaby St NE
- 120 Leverett St
- 197 Church St NE
- 187 Church St NE
- 188 Church St NE
- LOT 2 Wilbur Gamble Rd
- 207 Huckaby St NE
- 179 Huckaby St NE
Your Personal Tour Guide
Ask me questions while you tour the home.