J
Seller's Agent in 2013
John Sinclair
NOT A VALID MEMBER
Estimated Value: $202,000 - $277,000
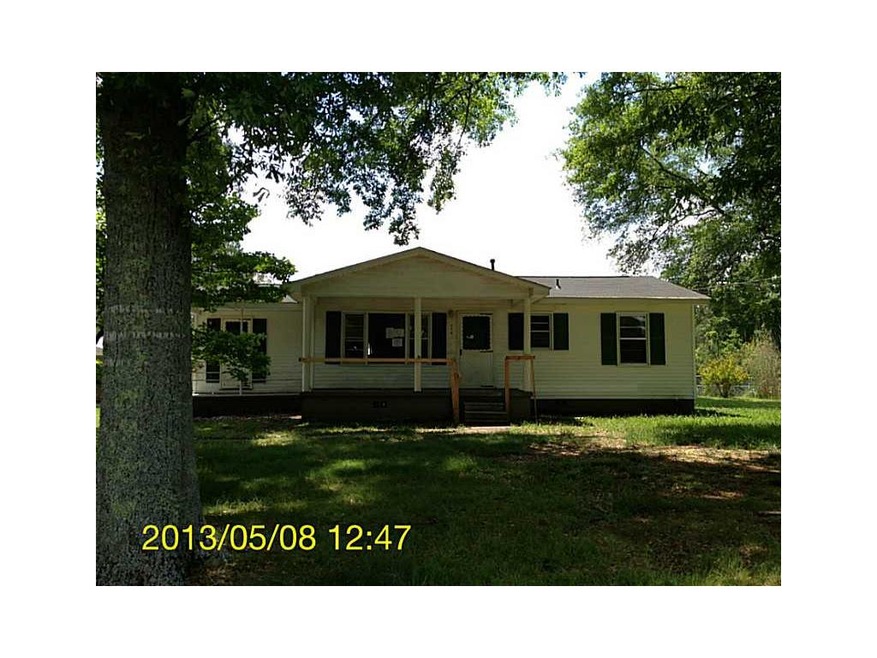
HUD owned. Case # 105-505413 FHA Insured with escrow (IE) Sold "as is" Equal Housing Opportunity. Great starter home at a great price. Nice property
Last Agent to Sell the Property
John Sinclair
NOT A VALID MEMBER License #DUP Listed on: 05/16/2013
Last Buyer's Agent
John Sinclair
NOT A VALID MEMBER License #DUP Listed on: 05/16/2013
We collect this data history from publicly available records. To have your information removed, we recommend requesting removal directly through your county’s website.
We collect this data history from publicly available records. To have your information removed, we recommend requesting removal directly through your county’s website.
| Date | Buyer | Sale Price | Title Company |
|---|---|---|---|
| -- | -- | ||
| -- | -- | ||
| $55,000 | -- | ||
| $44,600 | -- | ||
| $41,700 | -- | ||
| $91,198 | -- | ||
| -- | -- | ||
| -- | -- | ||
| $94,000 | -- | ||
| -- | -- | ||
| -- | -- | ||
| -- | -- | ||
| -- | -- | ||
| -- | -- | ||
| -- | -- | ||
| -- | -- |
We collect this data history from publicly available records. To have your information removed, we recommend requesting removal directly through your county’s website.
| Date | Status | Borrower | Loan Amount |
|---|---|---|---|
| Previous Owner | $44,600 | ||
| Previous Owner | $92,547 |
We collect this data history from publicly available records. To have your information removed, we recommend requesting removal directly through your county’s website.
| Date | Event | Price | List to Sale | Price per Sq Ft |
|---|---|---|---|---|
| 06/26/2013 06/26/13 | Sold | $41,700 | -3.0% | $31 / Sq Ft |
| 05/31/2013 05/31/13 | Pending | -- | -- | -- |
| 05/16/2013 05/16/13 | For Sale | $43,000 | -- | $32 / Sq Ft |
We collect this data history from publicly available records. To have your information removed, we recommend requesting removal directly through your county’s website.
| Year | Tax Paid | Tax Assessment Tax Assessment Total Assessment is a certain percentage of the fair market value that is determined by local assessors to be the total taxable value of land and additions on the property. | Land | Improvement |
|---|---|---|---|---|
| 2025 | $1,548 | $68,782 | $3,384 | $65,398 |
| 2024 | $1,415 | $67,706 | $2,308 | $65,398 |
| 2023 | $843 | $35,504 | $2,308 | $33,196 |
| 2022 | $718 | $30,246 | $1,538 | $28,708 |
| 2021 | $727 | $30,246 | $1,538 | $28,708 |
| 2020 | $729 | $30,246 | $1,538 | $28,708 |
| 2019 | $723 | $26,926 | $1,538 | $25,388 |
| 2018 | $720 | $26,130 | $1,538 | $24,592 |
| 2017 | $711 | $26,130 | $1,538 | $24,592 |
| 2016 | $749 | $27,521 | $2,928 | $24,592 |
| 2015 | $760 | $27,858 | $2,928 | $24,930 |
| 2014 | $490 | $27,858 | $2,928 | $24,930 |
J
Seller's Agent in 2013
John Sinclair
NOT A VALID MEMBER
Source: First Multiple Listing Service (FMLS)
MLS Number: 5147894
APN: 029-008
![]() Listings identified with the FMLS IDX logo come from FMLS and are held by brokerage firms other than the owner of this website. The listing brokerage is identified in any listing details. Information is deemed reliable but is not guaranteed. If you believe any FMLS listing contains material that infringes your copyrighted work please visit www.fmls.com/dmca to review our DMCA policy and learn how to submit a takedown request. © 2026 First Multiple Listing Service, Inc.
Listings identified with the FMLS IDX logo come from FMLS and are held by brokerage firms other than the owner of this website. The listing brokerage is identified in any listing details. Information is deemed reliable but is not guaranteed. If you believe any FMLS listing contains material that infringes your copyrighted work please visit www.fmls.com/dmca to review our DMCA policy and learn how to submit a takedown request. © 2026 First Multiple Listing Service, Inc.
Disclaimer: Certain information contained herein is derived from information provided by parties other than Homes.com. All information provided is deemed reliable, but is not guaranteed to be accurate and should be independently verified.
Ask me questions while you tour the home.
