W
Seller's Agent in 2025
Will Blount
Joe Stockdale Real Estate
(678) 495-7337
7 Total Sales
Estimated Value: $348,000 - $356,000
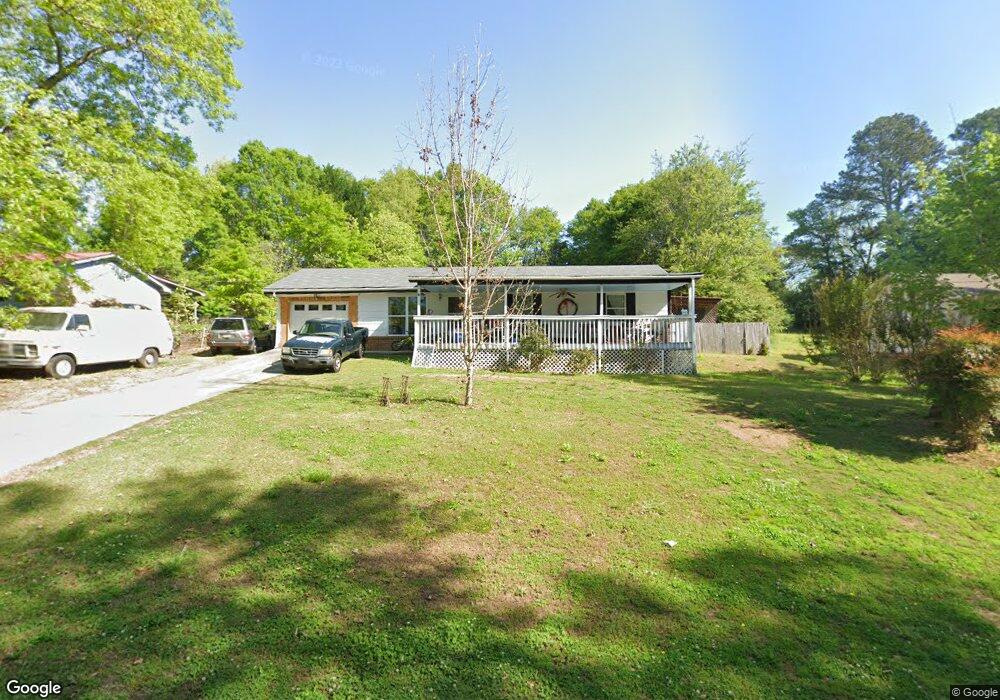
Charming home located on historic Spring Street, just a short stroll from Downtown Winder! This classic 2 bedroom, 2 bathroom beauty offers the best of established community living with modern convenience. Inside, you'll find original hardwood floors, an updated kitchen with new tile and stainless steel appliances that are on separate electrical circuits and a bright, welcoming main-level living area. The electrical has been updated within the last five years. New subflooring in kitchen and living room. Master Bedroom newly painted. The home also features a dedicated laundry room and ample storage. Step outside to a spacious, private, fenced backyard-perfect for relaxing, gardening, or entertaining friends with a 1000 square foot deck. Located minutes from Downtown Winder's vibrant shops, local restaurants, and community events. Excellent access to GA-316 makes commuting to Athens or the Atlanta area simple. Recent upgrades include a new roof (2022) NO HOA! This is a fantastic opportunity for owner-occupants and investors alike. Don't miss your chance to own a piece of classic Winder real estate. Schedule your private showing today!
| Date | Buyer | Sale Price | Title Company |
|---|---|---|---|
| Jackson Louise B | $23,000 | -- |
| Date | Event | Price | List to Sale | Price per Sq Ft |
|---|---|---|---|---|
| 11/24/2025 11/24/25 | For Sale | $360,000 | -- | $225 / Sq Ft |
| Year | Tax Paid | Tax Assessment Tax Assessment Total Assessment is a certain percentage of the fair market value that is determined by local assessors to be the total taxable value of land and additions on the property. | Land | Improvement |
|---|---|---|---|---|
| 2025 | $419 | $57,173 | $14,800 | $42,373 |
| 2024 | $424 | $56,021 | $14,800 | $41,221 |
| 2023 | $293 | $56,021 | $14,800 | $41,221 |
| 2022 | $355 | $44,108 | $14,800 | $29,308 |
| 2021 | $312 | $38,788 | $10,600 | $28,188 |
| 2020 | $302 | $38,788 | $10,600 | $28,188 |
| 2019 | $293 | $36,850 | $10,600 | $26,250 |
| 2018 | $268 | $36,850 | $10,600 | $26,250 |
| 2017 | $969 | $33,280 | $10,600 | $22,680 |
| 2016 | $218 | $33,280 | $10,600 | $22,680 |
| 2015 | $220 | $33,280 | $10,600 | $22,680 |
| 2014 | $249 | $27,874 | $5,194 | $22,680 |
| 2013 | -- | $26,917 | $5,194 | $21,723 |
W
Seller's Agent in 2025
Will Blount
Joe Stockdale Real Estate
(678) 495-7337
7 Total Sales
Ask me questions while you tour the home.
