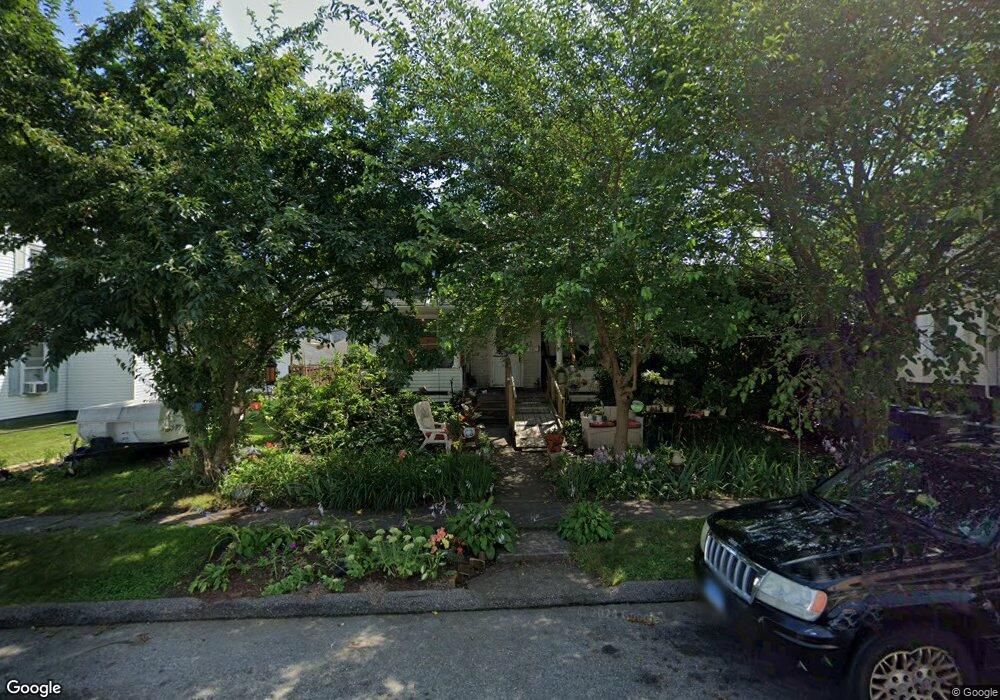
28 13th St Norwich, CT 06360
Central Norwich NeighborhoodEstimated Value: $236,000 - $260,000
3
Beds
1
Bath
1,480
Sq Ft
$168/Sq Ft
Est. Value
About This Home
This home is located at 28 13th St, Norwich, CT 06360 and is currently estimated at $249,088, approximately $168 per square foot. 28 13th St is a home located in New London County with nearby schools including Moriarty Magnet Elementary School, Kelly STEAM Magnet Middle School, and St. Joseph School.
Ownership History
Date
Name
Owned For
Owner Type
Purchase Details
Closed on
Apr 3, 2007
Sold by
Mckenna-Giancola Patricia and Mckenna-Giancola Trish
Bought by
Bapst Patricia and Bapst Michael
Current Estimated Value
Home Financials for this Owner
Home Financials are based on the most recent Mortgage that was taken out on this home.
Original Mortgage
$165,000
Interest Rate
6.33%
Create a Home Valuation Report for This Property
The Home Valuation Report is an in-depth analysis detailing your home's value as well as a comparison with similar homes in the area
Home Values in the Area
Average Home Value in this Area
Purchase History
| Date | Buyer | Sale Price | Title Company |
|---|---|---|---|
| Bapst Patricia | $165,000 | -- | |
| Bapst Patricia | $165,000 | -- |
Source: Public Records
Mortgage History
| Date | Status | Borrower | Loan Amount |
|---|---|---|---|
| Open | Bapst Patricia | $157,900 | |
| Closed | Bapst Patricia | $165,000 |
Source: Public Records
Tax History
| Year | Tax Paid | Tax Assessment Tax Assessment Total Assessment is a certain percentage of the fair market value that is determined by local assessors to be the total taxable value of land and additions on the property. | Land | Improvement |
|---|---|---|---|---|
| 2025 | $5,144 | $127,100 | $31,400 | $95,700 |
| 2024 | $4,855 | $127,100 | $31,400 | $95,700 |
| 2023 | $3,692 | $75,900 | $18,100 | $57,800 |
| 2022 | $3,680 | $75,900 | $18,100 | $57,800 |
| 2021 | $3,687 | $75,800 | $18,000 | $57,800 |
| 2020 | $3,674 | $75,800 | $18,000 | $57,800 |
| 2019 | $3,642 | $75,900 | $18,100 | $57,800 |
| 2018 | $3,271 | $67,600 | $14,600 | $53,000 |
| 2017 | $3,295 | $67,600 | $14,600 | $53,000 |
| 2016 | $3,316 | $67,600 | $14,600 | $53,000 |
| 2015 | $3,249 | $67,600 | $14,600 | $53,000 |
| 2014 | $3,105 | $67,600 | $14,600 | $53,000 |
Source: Public Records
Map
Nearby Homes
- 406 Central Ave Unit 408
- 540 N Main St
- 303 Central Ave
- 47 8th St
- 0 7th St
- 100 7th St
- 79 Roosevelt Ave
- 197 Central Ave
- 188 Central Ave
- 290 Boswell Ave
- 82 North St
- 296 Hamilton Ave Unit 25
- 1 Long Society Rd
- 687 N Main St
- 37 39 41 N Main St
- 39 Oakridge St
- 110 N Main St
- 168 Corning Rd
- 168 Boswell Ave
- 40 Beech St
Your Personal Tour Guide
Ask me questions while you tour the home.