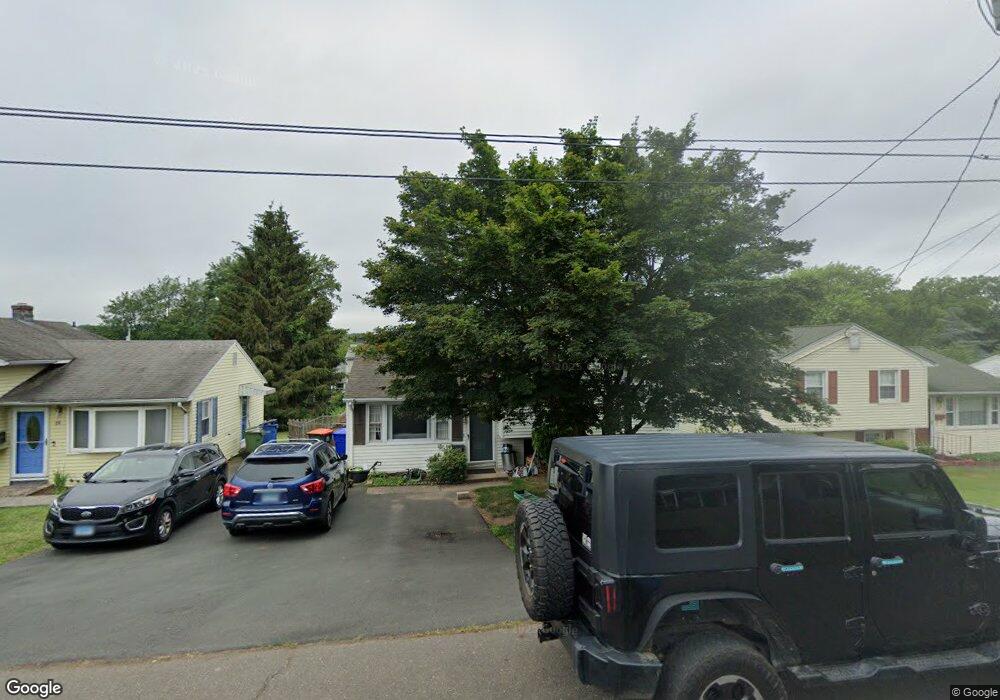
28 3rd St Wallingford, CT 06492
Estimated Value: $308,000 - $379,000
About This Home
This home is located at 28 3rd St, Wallingford, CT 06492 and is currently estimated at $337,103, approximately $372 per square foot. 28 3rd St is a home located in New Haven County with nearby schools including Moses Y Beach Elementary School, Rock Hill Elementary School, and Dag Hammarskjold Middle School.
Ownership History
We collect this data history from publicly available records. To have your information removed, we recommend requesting removal directly through your county’s website.
Purchase Details
Home Financials for this Owner
Home Financials are based on the most recent Mortgage that was taken out on this home.Purchase Details
Home Values in the Area
Average Home Value in this Area
Purchase History
We collect this data history from publicly available records. To have your information removed, we recommend requesting removal directly through your county’s website.
| Date | Buyer | Sale Price | Title Company |
|---|---|---|---|
| $193,000 | -- | ||
| $193,000 | -- | ||
| $114,000 | -- | ||
| $114,000 | -- |
Mortgage History
We collect this data history from publicly available records. To have your information removed, we recommend requesting removal directly through your county’s website.
| Date | Status | Borrower | Loan Amount |
|---|---|---|---|
| Open | $154,400 | ||
| Closed | $38,600 | ||
| Closed | $154,400 |
Tax History
We collect this data history from publicly available records. To have your information removed, we recommend requesting removal directly through your county’s website.
| Year | Tax Paid | Tax Assessment Tax Assessment Total Assessment is a certain percentage of the fair market value that is determined by local assessors to be the total taxable value of land and additions on the property. | Land | Improvement |
|---|---|---|---|---|
| 2025 | $4,028 | $167,000 | $70,600 | $96,400 |
| 2024 | $3,547 | $115,700 | $58,800 | $56,900 |
| 2023 | $3,395 | $115,700 | $58,800 | $56,900 |
| 2022 | $3,360 | $115,700 | $58,800 | $56,900 |
| 2021 | $3,300 | $115,700 | $58,800 | $56,900 |
| 2020 | $0 | $119,800 | $63,000 | $56,800 |
| 2019 | $3,497 | $119,800 | $63,000 | $56,800 |
| 2018 | $3,431 | $119,800 | $63,000 | $56,800 |
| 2017 | $3,420 | $119,800 | $63,000 | $56,800 |
| 2016 | $3,341 | $119,800 | $63,000 | $56,800 |
| 2015 | $3,316 | $120,700 | $63,000 | $57,700 |
| 2014 | $3,246 | $120,700 | $63,000 | $57,700 |
Map
- 36 3rd St
- 5 Dell Ct
- 44 Farm Hill Rd
- 108 N Whittlesey Ave
- 26 Beechwood Dr
- 85 N Colony St
- 12 Briarwood Ln
- 236 Hall Ave
- 61 Maple Ave
- 54 Claremont Ave
- 4 Evergreene Unit 4
- 42 S Cherry St Unit 307
- 47 Claremont Ave
- 17 Evergreene Unit 17
- 47 Spring St
- 40 S Cherry St Unit 18
- 90 Masonic Ave
- 74 Bull Ave
- 230 Main St Unit LOT 4A
- 230 Main St Unit 18
Ask me questions while you tour the home.