28 Algonquin Ln Saint Louis, MO 63119
Webster Groves AreaEstimated Value: $1,361,000 - $1,776,929
About This Home
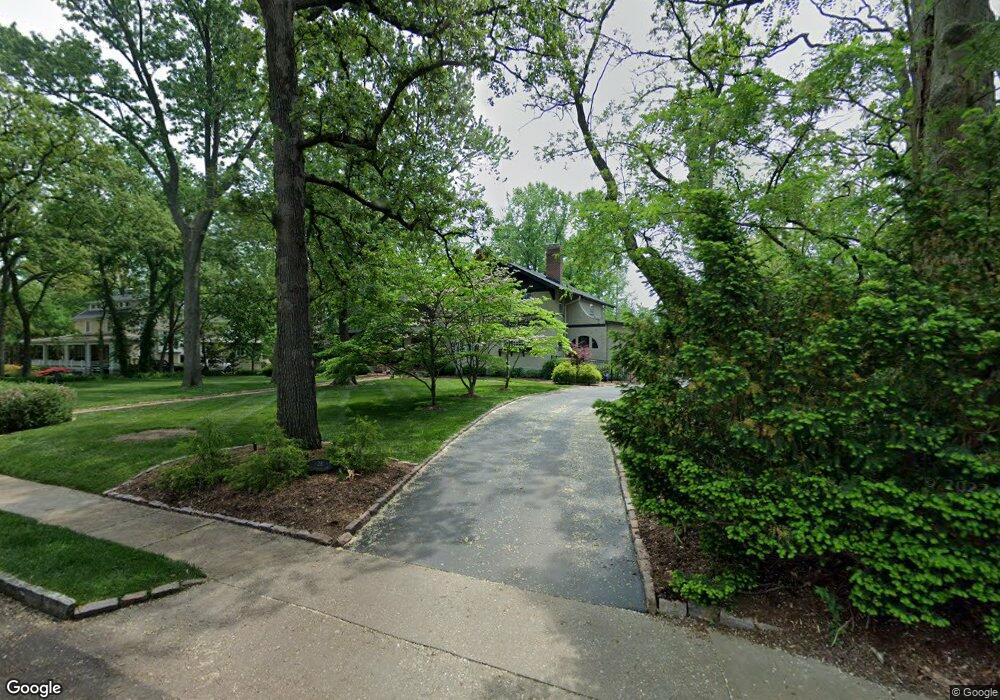
This home is located at 28 Algonquin Ln, Saint Louis, MO 63119 and is currently estimated at $1,514,232, approximately $400 per square foot. 28 Algonquin Ln is a home located in St. Louis County with nearby schools including Bristol Elementary School, Hixson Middle School, and Webster Groves High School.
Ownership History
We collect this data history from publicly available records. To have your information removed, we recommend requesting removal directly through your county’s website.
Purchase Details
Home Financials for this Owner
Home Financials are based on the most recent Mortgage that was taken out on this home.Home Values in the Area
Average Home Value in this Area
Purchase History
We collect this data history from publicly available records. To have your information removed, we recommend requesting removal directly through your county’s website.
| Date | Buyer | Sale Price | Title Company |
|---|---|---|---|
| $839,900 | Cltc |
Mortgage History
We collect this data history from publicly available records. To have your information removed, we recommend requesting removal directly through your county’s website.
| Date | Status | Borrower | Loan Amount |
|---|---|---|---|
| Open | $417,000 |
Tax History
We collect this data history from publicly available records. To have your information removed, we recommend requesting removal directly through your county’s website.
| Year | Tax Paid | Tax Assessment Tax Assessment Total Assessment is a certain percentage of the fair market value that is determined by local assessors to be the total taxable value of land and additions on the property. | Land | Improvement |
|---|---|---|---|---|
| 2025 | $16,116 | $266,570 | $116,170 | $150,400 |
| 2024 | $16,116 | $233,070 | $96,500 | $136,570 |
| 2023 | $16,037 | $233,070 | $96,500 | $136,570 |
| 2022 | $15,928 | $215,000 | $96,500 | $118,500 |
| 2021 | $15,873 | $215,000 | $96,500 | $118,500 |
| 2020 | $15,883 | $200,430 | $79,250 | $121,180 |
| 2019 | $15,769 | $200,430 | $79,250 | $121,180 |
| 2018 | $13,924 | $157,130 | $52,400 | $104,730 |
| 2017 | $13,830 | $157,130 | $52,400 | $104,730 |
| 2016 | $12,358 | $134,220 | $42,580 | $91,640 |
| 2015 | $12,437 | $134,220 | $42,580 | $91,640 |
| 2014 | $12,036 | $126,390 | $42,730 | $83,660 |
Map
- 465 Sherwood Dr
- 444 Sherwood Dr
- 253 Elm Ave
- 445 Algonquin Place
- 417 Elm Ave
- 424 Belleview Ave
- 638 Sherwood Dr
- 438 N Sappington Rd Unit A
- 620 S Rock Hill Rd
- 931 Brownell Ave
- 1053 Chelsea Ave
- 108 S Brent Ave
- 800 E Essex Ave
- 36 Southridge Ct
- 5 S Rock Hill Rd
- 446 W Kirkham Ave
- 423 Maelln Dr
- 646 E Adams Ave
- 1031 Glenmoor Ave
- 818 Sanders Place
- 26 Algonquin Ln
- 24 Algonquin Ln
- 1
- 1 Tbb Cornelia
- 1398 Beverly Ave
- 215 N Berry Rd
- 679 W Lockwood Ave
- 675 W Lockwood Ave
- 1392 Beverly Ave
- 10 Cornelia Ave
- 9 Cornelia Ave
- 683 W Lockwood Ave
- 22 Algonquin Ln
- 325 N Berry Rd
- 689 W Lockwood Ave
- 1386 Beverly Ave
- 667 W Lockwood Ave
- 693 W Lockwood Ave
- 107 Cornelia Ave
- 80 Cornelia Ave
Ask me questions while you tour the home.