
Seller's Agent in 2025
Amy Rio
Executive Real Estate
(860) 916-6048
7 in this area
1,115 Total Sales
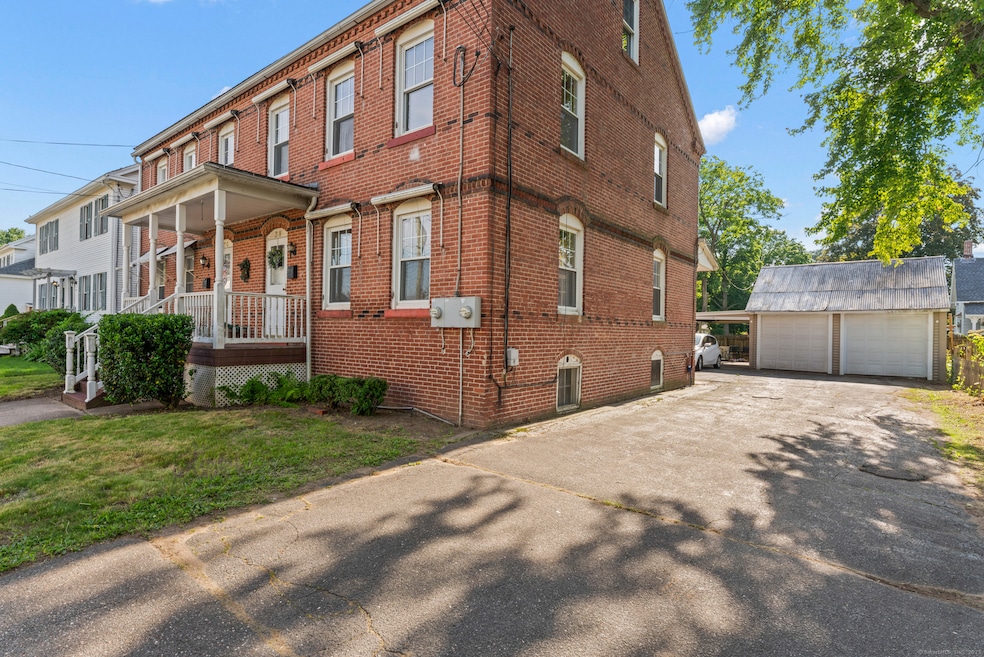
Classic Brick Half-Duplex with Detached Garage & Carport Welcome to 28 Chestnut Street - a spacious and solid brick half-duplex that blends charm, functionality, and convenience. With 3 bedrooms, 1.5 baths, and a thoughtful layout, this home offers everything you need with room to grow. Step inside to find hardwood floors throughout the living room and bedrooms, adding warmth and timeless character. The kitchen and dining room feature easy-to-maintain tile flooring, creating a clean and functional space for cooking and gathering. Enjoy three comfortable bedrooms upstairs along with a full bathroom, while a convenient half bath on the main level adds flexibility for guests. The basement offers great storage or potential for future finishing. Outside, the property includes a 2-car detached garage plus a 1-car carport, offering rare off-street parking options and extra space for your vehicles, hobbies, or equipment. A private backyard provides space for outdoor enjoyment or entertaining. Whether you're a first-time buyer, investor, or simply looking for a low-maintenance home with classic curb appeal, this one is a standout! Schedule your private showing today and take the next step toward homeownership!
Last Agent to Sell the Property
Executive Real Estate Inc. License #REB.0788717 Listed on: 06/06/2025
| Date | Type | Sale Price | Title Company |
|---|---|---|---|
| Warranty Deed | $249,900 | -- | |
| Warranty Deed | $249,900 | -- | |
| Warranty Deed | $100,000 | None Available | |
| Warranty Deed | $100,000 | None Available | |
| Quit Claim Deed | $54,000 | -- | |
| Quit Claim Deed | $54,000 | -- |
| Date | Status | Loan Amount | Loan Type |
|---|---|---|---|
| Open | $25,000 | New Conventional | |
| Closed | $25,000 | New Conventional | |
| Open | $238,909 | Future Advance Clause Open End Mortgage | |
| Closed | $238,909 | New Conventional | |
| Previous Owner | $153,400 | Purchase Money Mortgage | |
| Previous Owner | $50,000 | No Value Available |
| Date | Event | Price | List to Sale | Price per Sq Ft |
|---|---|---|---|---|
| 09/10/2025 09/10/25 | Sold | $249,900 | 0.0% | $183 / Sq Ft |
| 07/30/2025 07/30/25 | Pending | -- | -- | -- |
| 06/24/2025 06/24/25 | For Sale | $249,900 | 0.0% | $183 / Sq Ft |
| 06/19/2025 06/19/25 | Pending | -- | -- | -- |
| 06/09/2025 06/09/25 | For Sale | $249,900 | 0.0% | $183 / Sq Ft |
| 06/06/2025 06/06/25 | Off Market | $249,900 | -- | -- |
| 06/06/2025 06/06/25 | For Sale | $249,900 | -- | $183 / Sq Ft |
| Year | Tax Paid | Tax Assessment Tax Assessment Total Assessment is a certain percentage of the fair market value that is determined by local assessors to be the total taxable value of land and additions on the property. | Land | Improvement |
|---|---|---|---|---|
| 2025 | $3,362 | $140,140 | $37,800 | $102,340 |
| 2024 | $2,508 | $89,110 | $23,100 | $66,010 |
| 2023 | $2,346 | $89,110 | $23,100 | $66,010 |
| 2022 | $2,302 | $89,110 | $23,100 | $66,010 |
| 2021 | $2,302 | $89,110 | $23,100 | $66,010 |
| 2020 | $2,302 | $89,110 | $23,100 | $66,010 |
| 2019 | $2,302 | $89,110 | $23,100 | $66,010 |
| 2017 | $2,303 | $86,400 | $23,200 | $63,200 |
| 2016 | $2,303 | $86,400 | $23,200 | $63,200 |
| 2015 | $2,315 | $86,400 | $23,200 | $63,200 |
| 2014 | $2,623 | $100,000 | $26,300 | $73,700 |
Seller's Agent in 2025
Amy Rio
Executive Real Estate
(860) 916-6048
7 in this area
1,115 Total Sales
Buyer's Agent in 2025
CHARLES HARRIS
CLMA Realty
(860) 414-4579
1 in this area
51 Total Sales
Source: SmartMLS
MLS Number: 24101927
APN: WINL-000029-000052-000018
Disclaimer: Certain information contained herein is derived from information provided by parties other than Homes.com. All information provided is deemed reliable, but is not guaranteed to be accurate and should be independently verified.
![]() IDX information is provided exclusively for personal, non-commercial use, and may not be used for any purpose other than to identify prospective properties consumers may be interested in purchasing. Information is deemed reliable but not guaranteed.
IDX information is provided exclusively for personal, non-commercial use, and may not be used for any purpose other than to identify prospective properties consumers may be interested in purchasing. Information is deemed reliable but not guaranteed.
Ask me questions while you tour the home.