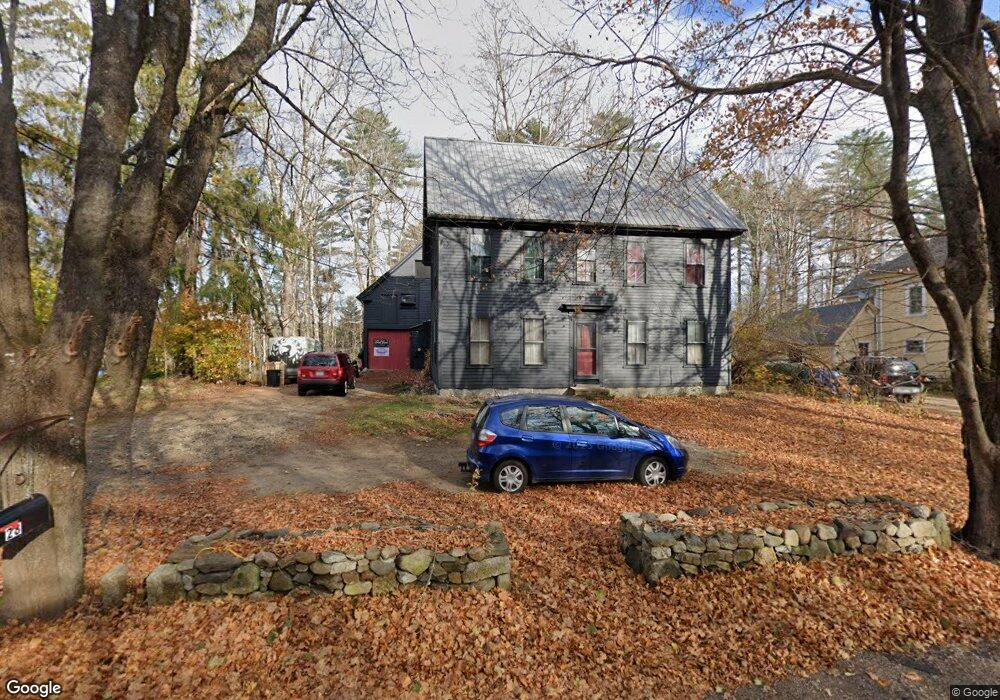
28 Cumberland St Cornish, ME 04020
Estimated Value: $284,000 - $367,000
3
Beds
3
Baths
2,266
Sq Ft
$139/Sq Ft
Est. Value
About This Home
This home is located at 28 Cumberland St, Cornish, ME 04020 and is currently estimated at $315,753, approximately $139 per square foot. 28 Cumberland St is a home located in York County.
Ownership History
Date
Name
Owned For
Owner Type
Purchase Details
Closed on
Nov 6, 2008
Sold by
Wells Fargo Bank Na Tr
Bought by
Tutor Tiffany K
Current Estimated Value
Home Financials for this Owner
Home Financials are based on the most recent Mortgage that was taken out on this home.
Original Mortgage
$85,666
Interest Rate
6.08%
Mortgage Type
FHA
Purchase Details
Closed on
May 14, 2008
Sold by
Miniutti Lisa Ellen
Bought by
Wells Fargo Bank Na Tr
Create a Home Valuation Report for This Property
The Home Valuation Report is an in-depth analysis detailing your home's value as well as a comparison with similar homes in the area
Home Values in the Area
Average Home Value in this Area
Purchase History
| Date | Buyer | Sale Price | Title Company |
|---|---|---|---|
| Tutor Tiffany K | -- | -- | |
| Wells Fargo Bank Na Tr | -- | -- |
Source: Public Records
Mortgage History
| Date | Status | Borrower | Loan Amount |
|---|---|---|---|
| Open | Wells Fargo Bank Na Tr | $116,249 | |
| Closed | Wells Fargo Bank Na Tr | $25,000 | |
| Closed | Wells Fargo Bank Na Tr | $85,666 | |
| Previous Owner | Wells Fargo Bank Na Tr | $40,000 |
Source: Public Records
Tax History
| Year | Tax Paid | Tax Assessment Tax Assessment Total Assessment is a certain percentage of the fair market value that is determined by local assessors to be the total taxable value of land and additions on the property. | Land | Improvement |
|---|---|---|---|---|
| 2025 | $3,011 | $318,600 | $56,600 | $262,000 |
| 2024 | $2,615 | $284,200 | $36,000 | $248,200 |
| 2023 | $2,301 | $160,900 | $32,600 | $128,300 |
| 2022 | $2,220 | $160,900 | $32,600 | $128,300 |
| 2021 | $2,172 | $160,900 | $32,600 | $128,300 |
| 2020 | $2,156 | $160,900 | $32,600 | $128,300 |
| 2019 | $1,938 | $160,900 | $32,600 | $128,300 |
| 2018 | $2,284 | $160,900 | $32,600 | $128,300 |
| 2016 | $2,074 | $160,900 | $32,600 | $128,300 |
| 2015 | $2,076 | $160,900 | $32,600 | $128,300 |
| 2014 | $2,051 | $159,000 | $32,600 | $126,400 |
Source: Public Records
Map
Nearby Homes
- 4 Bridge St
- 20 Main St
- 22 High Rd
- 120 Cumberland St
- U6-12 Main St
- 96 Maple St
- 110 Maple St
- Lot #2 Jordan Heights Rd
- 992 Pequawket Trail
- 0 Durgintown Rd
- 198 Senator Black Rd
- 14 Hunter Dr
- TBD Sokokis Trail N
- 174 Marston Rd
- R05-0023 Tripptown Rd
- 62 & 66 Brownfield Rd
- 66 Brownfield Rd
- 8 Graffam Rd
- 8 - A Graffam Rd
- 23 Pine St
Your Personal Tour Guide
Ask me questions while you tour the home.