28 Curtis St Quincy, MA 02169
Quincy Center NeighborhoodEstimated Value: $818,773 - $937,000
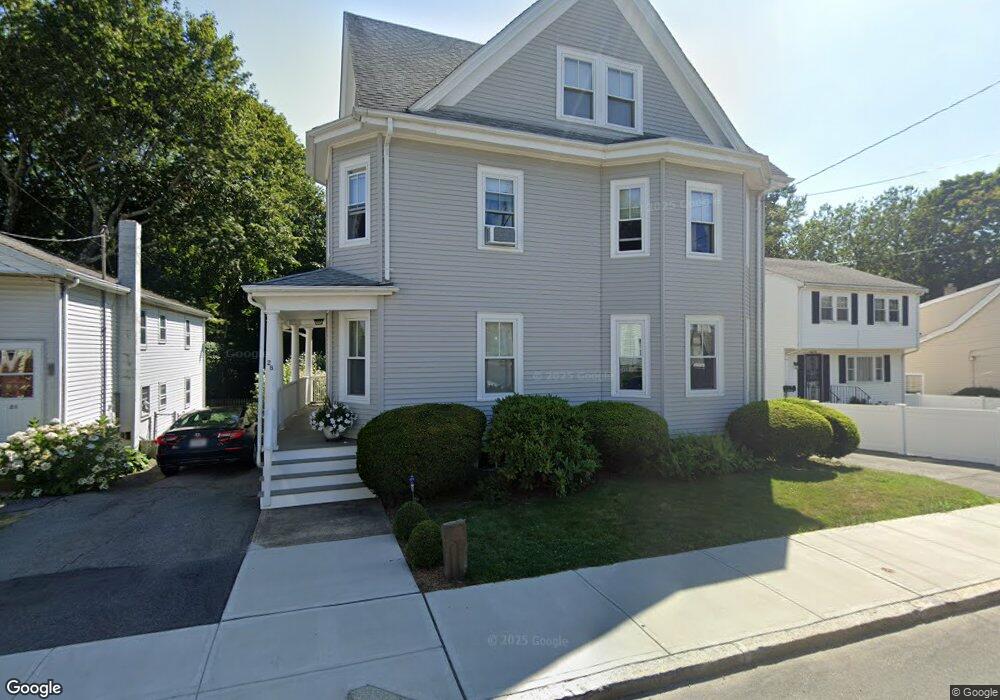
About This Home
This home is located at 28 Curtis St, Quincy, MA 02169 and is currently estimated at $881,693, approximately $428 per square foot. 28 Curtis St is a home located in Norfolk County with nearby schools including Charles A. Bernazzani Elementary School, Central Middle School, and Quincy High School.
Ownership History
We collect this data history from publicly available records. To have your information removed, we recommend requesting removal directly through your county’s website.
Purchase Details
Purchase Details
Purchase Details
Home Financials for this Owner
Home Financials are based on the most recent Mortgage that was taken out on this home.Home Values in the Area
Average Home Value in this Area
Purchase History
We collect this data history from publicly available records. To have your information removed, we recommend requesting removal directly through your county’s website.
| Date | Buyer | Sale Price | Title Company |
|---|---|---|---|
| -- | None Available | ||
| -- | -- | ||
| $178,000 | -- |
Mortgage History
We collect this data history from publicly available records. To have your information removed, we recommend requesting removal directly through your county’s website.
| Date | Status | Borrower | Loan Amount |
|---|---|---|---|
| Previous Owner | $130,000 |
Tax History
We collect this data history from publicly available records. To have your information removed, we recommend requesting removal directly through your county’s website.
| Year | Tax Paid | Tax Assessment Tax Assessment Total Assessment is a certain percentage of the fair market value that is determined by local assessors to be the total taxable value of land and additions on the property. | Land | Improvement |
|---|---|---|---|---|
| 2025 | $8,234 | $714,100 | $307,900 | $406,200 |
| 2024 | $7,718 | $684,800 | $293,300 | $391,500 |
| 2023 | $7,326 | $658,200 | $266,700 | $391,500 |
| 2022 | $7,321 | $611,100 | $242,500 | $368,600 |
| 2021 | $6,818 | $561,600 | $242,500 | $319,100 |
| 2020 | $6,838 | $550,100 | $230,900 | $319,200 |
| 2019 | $6,411 | $510,800 | $217,900 | $292,900 |
| 2018 | $6,670 | $500,000 | $217,900 | $282,100 |
| 2017 | $6,260 | $441,800 | $207,600 | $234,200 |
| 2016 | $5,865 | $408,400 | $197,700 | $210,700 |
| 2015 | $5,939 | $406,800 | $197,700 | $209,100 |
| 2014 | $5,301 | $356,700 | $188,300 | $168,400 |
Map
- 165 Whitwell St
- 183 Whitwell St
- 18 Prout St
- 53 Packards Ln Unit 3
- 250 Whitwell St Unit 2
- 40 Quarry St
- 162 Glendale Rd
- 91 Garfield St
- 43 Dixwell Ave
- 30 Tinson Rd
- 3 Gothland St
- 166 Suomi Rd
- 95 & 97 Copeland St
- 16 Parker St
- 148 Presidents Ln Unit 4
- 87 Dewson Rd
- 195 Thomas Burgin Pkwy Unit 505
- 211 Copeland St
- 20 Miller St Unit 2
- 77 Adams St Unit 210
- 24 Curtis St
- 24 Curtis St Unit 24 Curtis St. 1
- 32 Curtis St
- 36 Curtis St
- 18 Curtis St
- 31 Farrell St
- 23 Curtis St
- 12 Curtis St Unit 2
- 12 Curtis St
- 12 Curtis St Unit 3
- 19 Curtis St
- 19 Curtis St Unit 2
- 10 Curtis St Unit 5
- 10 Curtis St Unit 4
- 10 Curtis St Unit 3
- 10 Curtis St Unit 2
- 10 Curtis St Unit 1
- 10 Curtis St
- 44 Curtis St
- 17 Curtis St
Ask me questions while you tour the home.