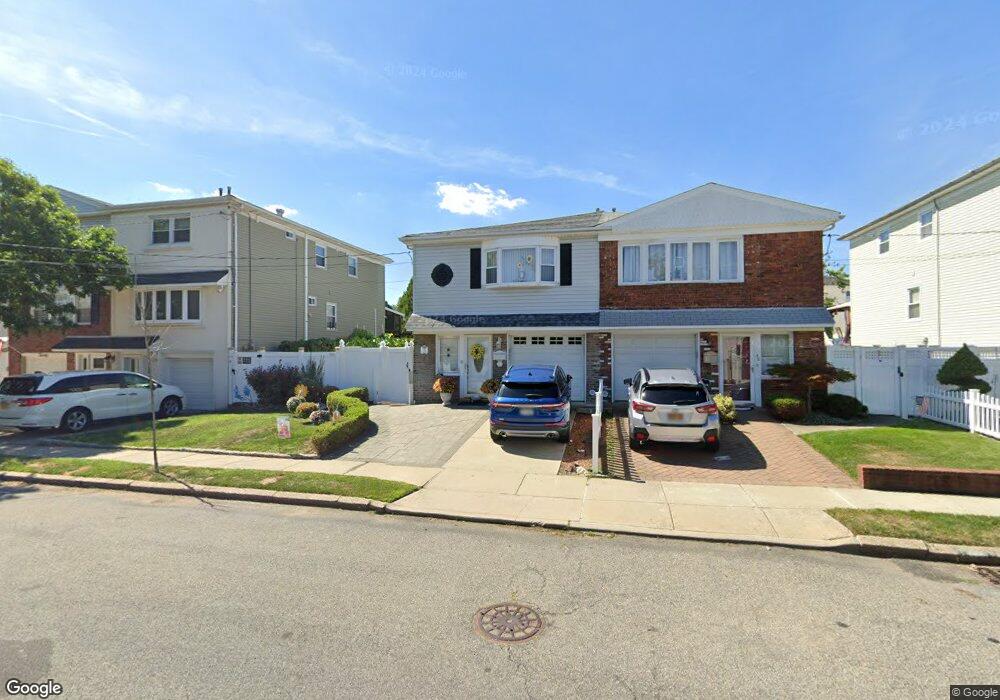
28 E Broadway Staten Island, NY 10306
Oakwood NeighborhoodEstimated Value: $715,000 - $870,000
4
Beds
2
Baths
1,800
Sq Ft
$438/Sq Ft
Est. Value
About This Home
This home is located at 28 E Broadway, Staten Island, NY 10306 and is currently estimated at $788,561, approximately $438 per square foot. 28 E Broadway is a home located in Richmond County with nearby schools including P.S. 23 Richmondtown, Myra S. Barnes Intermediate School 24, and New Dorp High School.
Ownership History
Date
Name
Owned For
Owner Type
Purchase Details
Closed on
Apr 15, 2022
Sold by
Ying Zhu Zoey
Bought by
Zhu Zoey Ying
Current Estimated Value
Purchase Details
Closed on
May 24, 2018
Sold by
Nastro Daniel A and Nastro Annette V
Bought by
Zhu Zoey Ying and Qiu Keyun
Home Financials for this Owner
Home Financials are based on the most recent Mortgage that was taken out on this home.
Original Mortgage
$390,000
Interest Rate
4.5%
Mortgage Type
New Conventional
Create a Home Valuation Report for This Property
The Home Valuation Report is an in-depth analysis detailing your home's value as well as a comparison with similar homes in the area
Home Values in the Area
Average Home Value in this Area
Purchase History
| Date | Buyer | Sale Price | Title Company |
|---|---|---|---|
| Zhu Zoey Ying | -- | None Listed On Document | |
| Zhu Zoey Ying | $590,000 | Leader Abstract Inc |
Source: Public Records
Mortgage History
| Date | Status | Borrower | Loan Amount |
|---|---|---|---|
| Previous Owner | Zhu Zoey Ying | $390,000 |
Source: Public Records
Tax History
| Year | Tax Paid | Tax Assessment Tax Assessment Total Assessment is a certain percentage of the fair market value that is determined by local assessors to be the total taxable value of land and additions on the property. | Land | Improvement |
|---|---|---|---|---|
| 2025 | $6,898 | $50,820 | $6,963 | $43,857 |
| 2024 | $6,898 | $41,520 | $8,040 | $33,480 |
| 2023 | $6,580 | $32,400 | $7,280 | $25,120 |
| 2022 | $5,555 | $40,680 | $9,720 | $30,960 |
| 2021 | $6,197 | $39,180 | $9,720 | $29,460 |
| 2020 | $6,125 | $33,780 | $9,720 | $24,060 |
| 2019 | $5,694 | $30,960 | $9,720 | $21,240 |
| 2018 | $5,206 | $27,000 | $9,720 | $17,280 |
| 2017 | $4,947 | $25,740 | $9,720 | $16,020 |
| 2016 | $5,232 | $27,720 | $9,720 | $18,000 |
| 2015 | $4,497 | $26,520 | $8,449 | $18,071 |
| 2014 | $4,497 | $25,021 | $7,884 | $17,137 |
Source: Public Records
Map
Nearby Homes
- 42 Amber St
- 56 Wolverine St
- 69 Cedarview Ave
- 132 Cedarview Ave
- 6 Arc Place Unit B5
- 143 Wolverine St
- 118 Guyon Ave Unit 122
- 223 Park St
- 122 Guyon Ave
- 103 Dalton Ave
- 77 Acorn St
- 45 Francine Ct Unit B
- 52A Francine Ct Unit 80A
- 61 Francine Ct Unit B
- 110 Bishop St
- 44 Tarring St
- 144 Guyon Ave
- 1926 N Railroad Ave
- 174 Barbara St
- 269 Park St
Your Personal Tour Guide
Ask me questions while you tour the home.