28 E Main St Osgood, OH 45351
Estimated Value: $233,191 - $340,000
About This Home
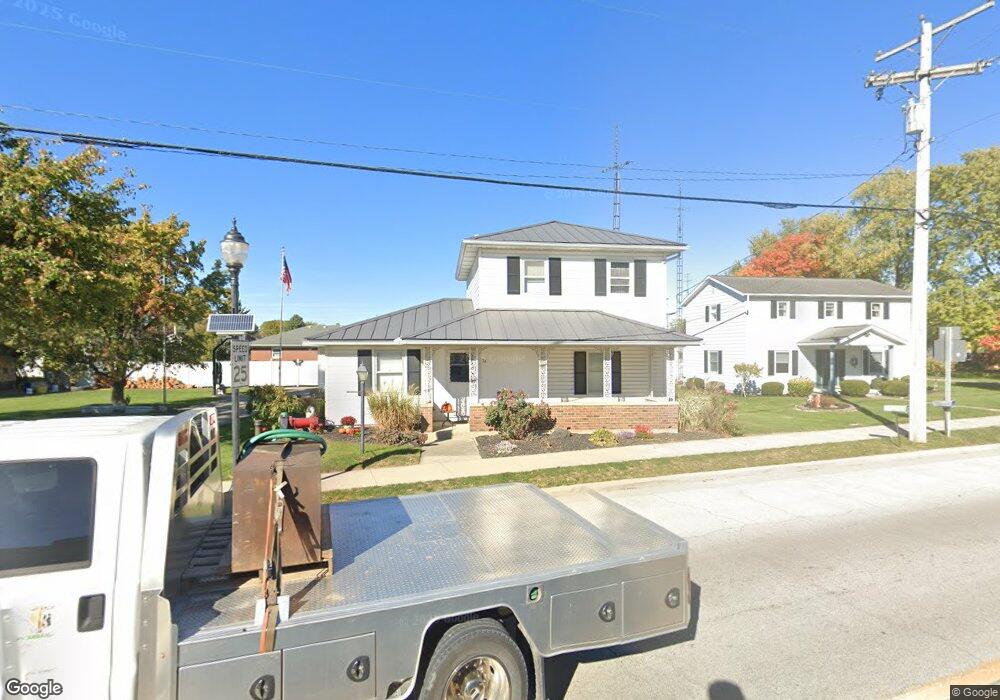
This home is located at 28 E Main St, Osgood, OH 45351 and is currently estimated at $273,048, approximately $138 per square foot. 28 E Main St is a home with nearby schools including Marion Local Elementary School and Marion Local High School.
Ownership History
We collect this data history from publicly available records. To have your information removed, we recommend requesting removal directly through your county’s website.
Purchase Details
Home Financials for this Owner
Home Financials are based on the most recent Mortgage that was taken out on this home.Purchase Details
Purchase History
We collect this data history from publicly available records. To have your information removed, we recommend requesting removal directly through your county’s website.
| Date | Buyer | Sale Price | Title Company |
|---|---|---|---|
| $157,500 | Attorney | ||
| $120,000 | Attorney |
Mortgage History
We collect this data history from publicly available records. To have your information removed, we recommend requesting removal directly through your county’s website.
| Date | Status | Borrower | Loan Amount |
|---|---|---|---|
| Open | $84,000 |
Tax History
We collect this data history from publicly available records. To have your information removed, we recommend requesting removal directly through your county’s website.
| Year | Tax Paid | Tax Assessment Tax Assessment Total Assessment is a certain percentage of the fair market value that is determined by local assessors to be the total taxable value of land and additions on the property. | Land | Improvement |
|---|---|---|---|---|
| 2025 | $1,983 | $54,350 | $6,100 | $48,250 |
| 2024 | $1,983 | $54,350 | $6,100 | $48,250 |
| 2023 | $1,985 | $54,350 | $6,100 | $48,250 |
| 2022 | $1,764 | $42,560 | $5,160 | $37,400 |
| 2021 | $1,622 | $42,560 | $5,160 | $37,400 |
| 2020 | $1,627 | $42,560 | $5,160 | $37,400 |
| 2019 | $1,962 | $35,080 | $5,160 | $29,920 |
| 2018 | $2,020 | $35,080 | $5,160 | $29,920 |
| 2017 | $2,731 | $35,080 | $5,160 | $29,920 |
| 2016 | $2,171 | $34,390 | $5,180 | $29,210 |
| 2015 | $2,068 | $34,390 | $5,180 | $29,210 |
| 2014 | $1,742 | $34,390 | $5,180 | $29,210 |
| 2013 | $1,130 | $31,730 | $5,180 | $26,550 |
Map
- 149 Brewer Dr
- 154 Liberty Dr
- 156 Veterans Dr
- 148 Brewer Dr
- 145 Liberty Dr
- 155 Liberty Dr
- 146 Liberty Dr
- 143 Liberty Dr
- 135 Veterans Dr
- 144 Liberty Dr
- 147 Veterans Dr
- 138 Liberty Dr
- 136 Liberty Dr
- 137 Liberty Dr
- 142 Liberty Dr
- 141 Liberty Dr
- 139 Liberty Dr
- 140 Liberty Dr
- 157 Mendenhall Rd
- 159 Mendenhall Rd
Ask me questions while you tour the home.