28 Emerald St Medford, MA 02155
Glenwood NeighborhoodEstimated Value: $950,000 - $1,013,000
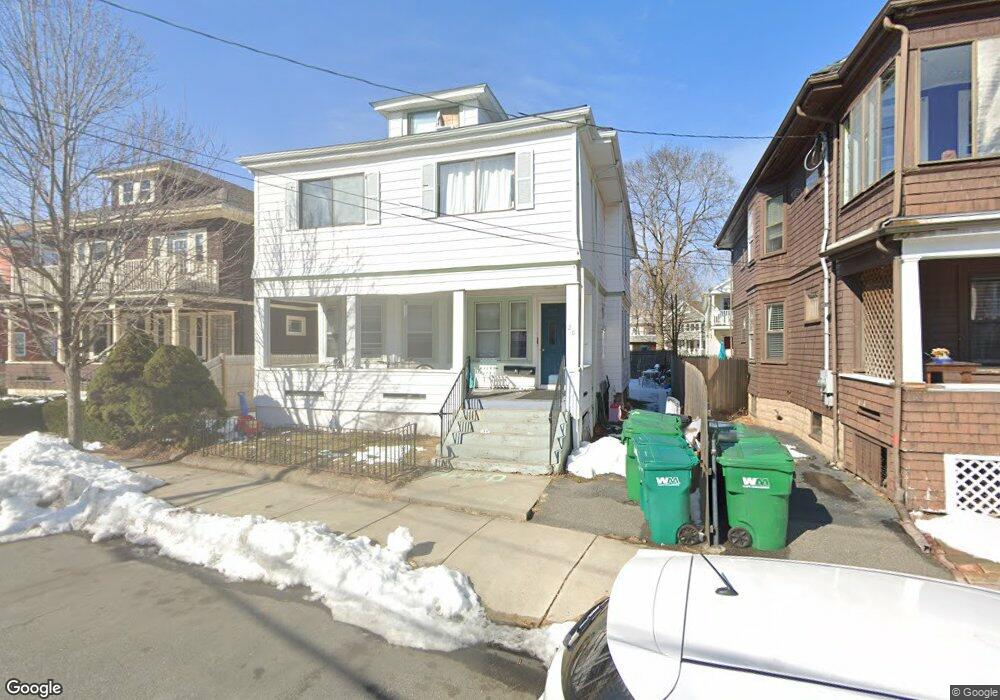
About This Home
This home is located at 28 Emerald St, Medford, MA 02155 and is currently estimated at $983,620, approximately $397 per square foot. 28 Emerald St is a home located in Middlesex County with nearby schools including Medford High School, Mystic Valley Regional Charter School, and St. Joseph School.
Ownership History
We collect this data history from publicly available records. To have your information removed, we recommend requesting removal directly through your county’s website.
Purchase Details
Home Financials for this Owner
Home Financials are based on the most recent Mortgage that was taken out on this home.Home Values in the Area
Average Home Value in this Area
Purchase History
We collect this data history from publicly available records. To have your information removed, we recommend requesting removal directly through your county’s website.
| Date | Buyer | Sale Price | Title Company |
|---|---|---|---|
| $430,000 | -- |
Mortgage History
We collect this data history from publicly available records. To have your information removed, we recommend requesting removal directly through your county’s website.
| Date | Status | Borrower | Loan Amount |
|---|---|---|---|
| Open | $387,000 |
Tax History
We collect this data history from publicly available records. To have your information removed, we recommend requesting removal directly through your county’s website.
| Year | Tax Paid | Tax Assessment Tax Assessment Total Assessment is a certain percentage of the fair market value that is determined by local assessors to be the total taxable value of land and additions on the property. | Land | Improvement |
|---|---|---|---|---|
| 2025 | $7,542 | $857,100 | $314,700 | $542,400 |
| 2024 | $6,928 | $813,200 | $299,700 | $513,500 |
| 2023 | $6,787 | $784,600 | $280,100 | $504,500 |
| 2022 | $6,839 | $759,100 | $254,600 | $504,500 |
| 2021 | $6,418 | $682,000 | $242,500 | $439,500 |
| 2020 | $6,327 | $689,200 | $242,500 | $446,700 |
| 2019 | $6,023 | $627,400 | $220,500 | $406,900 |
| 2018 | $5,720 | $558,600 | $200,400 | $358,200 |
| 2017 | $5,360 | $507,600 | $187,300 | $320,300 |
| 2016 | $5,227 | $467,100 | $170,300 | $296,800 |
| 2015 | $4,927 | $421,100 | $162,200 | $258,900 |
Map
- 92 Sheridan Ave
- 33 Farragut Ave
- 68 Central Ave Unit 304
- 53 Sheridan Ave Unit 1
- 61 Central Ave
- 17 Cherry St Unit 2
- 17 Cherry St
- 37 Sheridan Ave Unit 1
- 154 Fellsway W Unit 3
- 244 Central Ave Unit 5
- 244 Central Ave Unit 2
- 28 Cherry St Unit 28
- 38 Cherry St
- 31 Central Ave
- 57 Lawrence St
- 91 Dudley St
- 16 Saint Mary St
- 21 Fells Ave
- 92 Dudley St
- 179 Park St Unit 403
- 54 Yeomans Ave
- 54 Yeomans Ave Unit 54
- 52 Yeomans Ave
- 50 Yeomans Ave Unit 2
- 50 Yeomans Ave Unit 1
- 48 Yeomans Ave
- 48 Yeomans Ave Unit 1
- 62 Yeomans Ave
- 209 Spring St
- 44 Yeomans Ave
- 44 Yeomans Ave Unit 1
- 44 Yeomans Ave Unit 2
- 64 Yeomans Ave Unit 2
- 205 Spring St
- 69 Yeoman's Ave
- 3 Carney St
- 213 Spring St
- 1 Carney St
- 203 Spring St
- 203 Spring St Unit 1
Ask me questions while you tour the home.