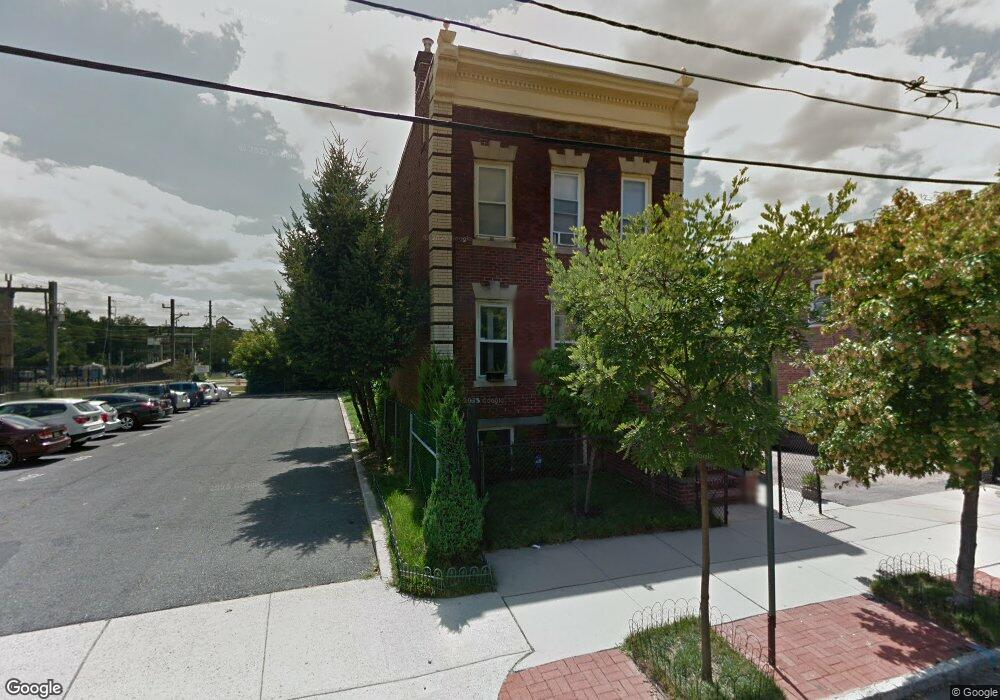
28 Grant St Montclair, NJ 07042
Estimated Value: $696,000 - $918,241
1
Bed
1
Bath
1,470
Sq Ft
$530/Sq Ft
Est. Value
About This Home
This home is located at 28 Grant St, Montclair, NJ 07042 and is currently estimated at $778,560, approximately $529 per square foot. 28 Grant St is a home located in Essex County with nearby schools including Hillside School, Nishuane School, and Bradford School.
Ownership History
We collect this data history from publicly available records. To have your information removed, we recommend requesting removal directly through your county’s website.
Date
Name
Owned For
Owner Type
Purchase Details
Closed on
Dec 19, 2005
Sold by
Bought by
Current Estimated Value
Home Financials for this Owner
Home Financials are based on the most recent Mortgage that was taken out on this home.
Original Mortgage
$386,938
Outstanding Balance
$217,394
Interest Rate
6.36%
Mortgage Type
FHA
Estimated Equity
$561,166
Purchase Details
Closed on
Feb 28, 2002
Sold by
Bought by
Home Financials for this Owner
Home Financials are based on the most recent Mortgage that was taken out on this home.
Original Mortgage
$186,000
Interest Rate
7.04%
Create a Home Valuation Report for This Property
The Home Valuation Report is an in-depth analysis detailing your home's value as well as a comparison with similar homes in the area
Home Values in the Area
Average Home Value in this Area
Tax History
We collect this data history from publicly available records. To have your information removed, we recommend requesting removal directly through your county’s website.
| Year | Tax Paid | Tax Assessment Tax Assessment Total Assessment is a certain percentage of the fair market value that is determined by local assessors to be the total taxable value of land and additions on the property. | Land | Improvement |
|---|---|---|---|---|
| 2025 | $13,442 | $382,300 | $187,600 | $194,700 |
| 2024 | $12,922 | $382,300 | $187,600 | $194,700 |
| 2022 | $12,570 | $382,300 | $187,600 | $194,700 |
| 2021 | $12,352 | $382,300 | $187,600 | $194,700 |
| 2020 | $12,153 | $382,300 | $187,600 | $194,700 |
| 2019 | $12,027 | $382,300 | $187,600 | $194,700 |
| 2018 | $11,828 | $382,300 | $187,600 | $194,700 |
| 2017 | $12,001 | $321,400 | $152,500 | $168,900 |
| 2016 | $11,680 | $321,400 | $152,500 | $168,900 |
| 2015 | $11,333 | $321,400 | $152,500 | $168,900 |
| 2014 | $10,953 | $321,400 | $152,500 | $168,900 |
Source: Public Records
Map
Nearby Homes
- 1 Grant St
- 80 Bay St Unit 8
- 34 Cloverhill Place
- 50 Pine St Unit 214
- 50 Pine St Unit 215
- 14 Grove Terrace
- 76 Grove St
- 103 Highland Ave
- 220 Bloomfield Ave
- 51 Greenwood Ave Unit 4
- 146 Sherman Ave
- 41 Mission St
- 295 Bloomfield Ave Unit 9
- 295 Bloomfield Ave Unit C0009
- 129 Claremont Ave Unit 2
- 971 Bloomfield Ave
- 380 Ridgewood Ave
- 926 Bloomfield Ave Unit 3L
- 926 Bloomfield Ave Unit 3A
- 296 Ridgewood Ave
- 29 Grant St
- 29 Grant St Unit 2
- 27 Grant St Unit 1
- 32 & 34 Grant St
- 14 Sherman St
- 89 Pine St
- 28 Grant St Unit 2
- 87 Pine St
- 87 Pine St Unit 6
- 87 Pine St Unit 3
- 87 Pine St Unit 5
- 91 Pine St
- 91 Pine St Unit 2L
- 91 Pine St Unit 2R
- 91 Pine St Unit 3R
- 91 Pine St Unit 1L
- 91 Pine St Unit 3l
- 32 Grant St
- 93 Pine St Unit 3R
- 93 Pine St Unit 3L
Your Personal Tour Guide
Ask me questions while you tour the home.