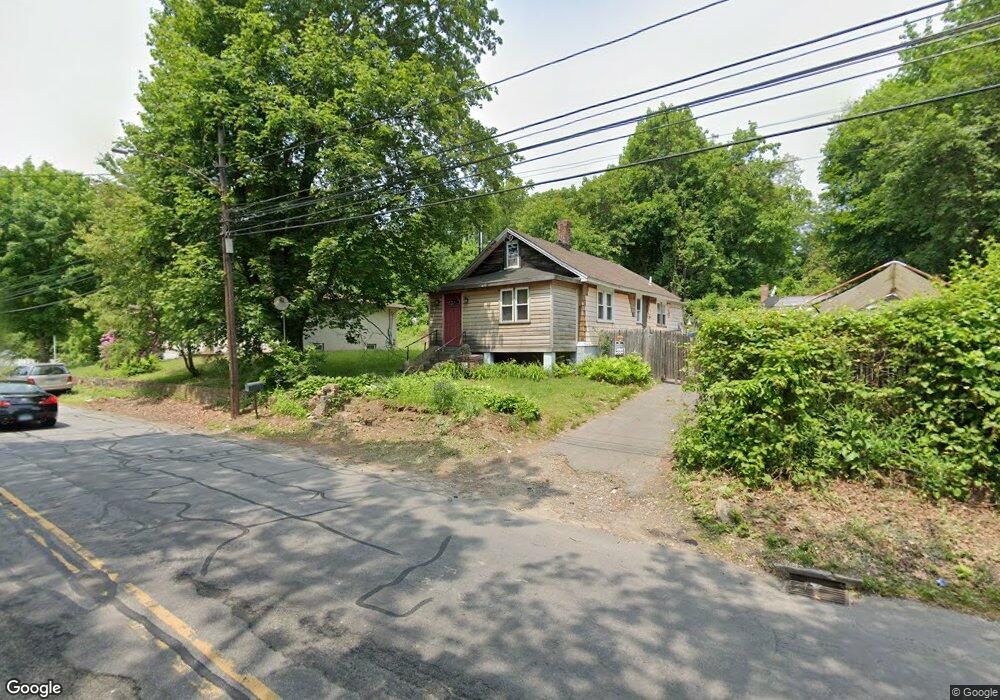
28 Overlook Ave Bridgeport, CT 06606
North End NeighborhoodEstimated Value: $335,000 - $471,000
4
Beds
2
Baths
1,332
Sq Ft
$308/Sq Ft
Est. Value
About This Home
This home is located at 28 Overlook Ave, Bridgeport, CT 06606 and is currently estimated at $409,655, approximately $307 per square foot. 28 Overlook Ave is a home located in Fairfield County with nearby schools including Wilbur L. Cross Elementary School, Central High School, and Northeastern Adventist Academy - Fairfield County.
Ownership History
Date
Name
Owned For
Owner Type
Purchase Details
Closed on
Jul 1, 2016
Sold by
Tri State Property Llc
Bought by
Sahar Ophir
Current Estimated Value
Home Financials for this Owner
Home Financials are based on the most recent Mortgage that was taken out on this home.
Original Mortgage
$154,000
Outstanding Balance
$120,596
Interest Rate
3.58%
Mortgage Type
Credit Line Revolving
Estimated Equity
$289,059
Purchase Details
Closed on
Feb 5, 2016
Sold by
Benchmark Municipal Ta
Bought by
Tri State Property Llc
Purchase Details
Closed on
Aug 4, 2015
Sold by
Vasquez Birnani and Pension Services Llc
Bought by
Pension Services Llc
Purchase Details
Closed on
Nov 7, 2008
Sold by
Vasquez Birnani
Bought by
Pension Svcs Llc
Create a Home Valuation Report for This Property
The Home Valuation Report is an in-depth analysis detailing your home's value as well as a comparison with similar homes in the area
Home Values in the Area
Average Home Value in this Area
Purchase History
| Date | Buyer | Sale Price | Title Company |
|---|---|---|---|
| Sahar Ophir | -- | -- | |
| Tri State Property Llc | $32,500 | -- | |
| Benchmark Municipal Ta | -- | -- | |
| Pension Services Llc | -- | -- | |
| Pension Svcs Llc | $60,000 | -- | |
| Sahar Ophir | -- | -- | |
| Benchmark Municipal Ta | -- | -- | |
| Pension Services Llc | -- | -- | |
| Pension Svcs Llc | $60,000 | -- |
Source: Public Records
Mortgage History
| Date | Status | Borrower | Loan Amount |
|---|---|---|---|
| Open | Pension Svcs Llc | $154,000 | |
| Closed | Pension Svcs Llc | $154,000 |
Source: Public Records
Tax History
| Year | Tax Paid | Tax Assessment Tax Assessment Total Assessment is a certain percentage of the fair market value that is determined by local assessors to be the total taxable value of land and additions on the property. | Land | Improvement |
|---|---|---|---|---|
| 2025 | $6,114 | $140,720 | $76,100 | $64,620 |
| 2024 | $6,114 | $140,720 | $76,100 | $64,620 |
| 2023 | $6,114 | $140,720 | $76,100 | $64,620 |
| 2022 | $6,114 | $140,720 | $76,100 | $64,620 |
| 2021 | $6,114 | $140,720 | $76,100 | $64,620 |
| 2020 | $4,366 | $80,870 | $39,750 | $41,120 |
| 2019 | $4,366 | $80,870 | $39,750 | $41,120 |
| 2018 | $4,397 | $80,870 | $39,750 | $41,120 |
| 2017 | $5,496 | $101,090 | $39,750 | $61,340 |
| 2016 | $5,496 | $101,090 | $39,750 | $61,340 |
| 2015 | $5,172 | $122,550 | $45,700 | $76,850 |
| 2014 | -- | $122,550 | $45,700 | $76,850 |
Source: Public Records
Map
Nearby Homes
- 675 Platt St
- 936 Chopsey Hill Rd
- 495 Alba Ave
- 240 Valley Ave
- 475 Alba Ave
- 65 Clearview Dr
- 500 Woodlawn Avenue Extension
- 410 Platt St
- 26 Victory St
- 213 Exeter St
- 219 Exeter St
- 364 Griffin Ave
- 315 Tesiny Ave
- 420 Greenwood St
- 578 Beechmont Ave
- 1376 Chopsey Hill Rd
- 274 Platt St
- 410 Alba Ave
- 277 Alba Ave
- 75 Fleet St
Your Personal Tour Guide
Ask me questions while you tour the home.