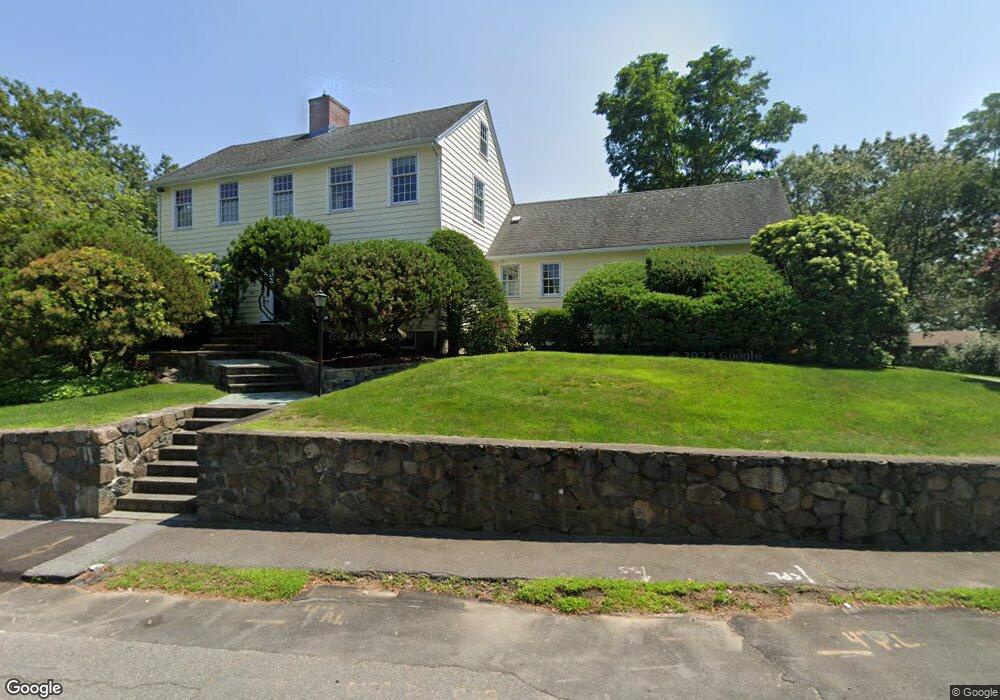
28 Pinecliff Dr Marblehead, MA 01945
Estimated Value: $1,161,353 - $1,680,000
4
Beds
3
Baths
2,128
Sq Ft
$642/Sq Ft
Est. Value
About This Home
This home is located at 28 Pinecliff Dr, Marblehead, MA 01945 and is currently estimated at $1,365,588, approximately $641 per square foot. 28 Pinecliff Dr is a home located in Essex County with nearby schools including Marblehead High School, Marblehead Community Charter Public School, and Tower School.
Ownership History
Date
Name
Owned For
Owner Type
Purchase Details
Closed on
Jul 8, 1993
Sold by
Cuoughlan Herbert H
Bought by
Holliday Richard C and Mcgough Maury
Current Estimated Value
Home Financials for this Owner
Home Financials are based on the most recent Mortgage that was taken out on this home.
Original Mortgage
$344,250
Interest Rate
7.43%
Mortgage Type
Purchase Money Mortgage
Create a Home Valuation Report for This Property
The Home Valuation Report is an in-depth analysis detailing your home's value as well as a comparison with similar homes in the area
Home Values in the Area
Average Home Value in this Area
Purchase History
| Date | Buyer | Sale Price | Title Company |
|---|---|---|---|
| Holliday Richard C | $405,000 | -- | |
| Holliday Richard C | $405,000 | -- |
Source: Public Records
Mortgage History
| Date | Status | Borrower | Loan Amount |
|---|---|---|---|
| Open | Holliday Richard C | $509,000 | |
| Closed | Holliday Richard C | $514,500 | |
| Closed | Holliday Richard C | $344,250 |
Source: Public Records
Tax History
| Year | Tax Paid | Tax Assessment Tax Assessment Total Assessment is a certain percentage of the fair market value that is determined by local assessors to be the total taxable value of land and additions on the property. | Land | Improvement |
|---|---|---|---|---|
| 2025 | $11,856 | $1,310,000 | $891,500 | $418,500 |
| 2024 | $12,129 | $1,353,700 | $948,400 | $405,300 |
| 2023 | $11,619 | $1,161,900 | $834,600 | $327,300 |
| 2022 | $10,957 | $1,041,500 | $720,800 | $320,700 |
| 2021 | $10,214 | $980,200 | $663,900 | $316,300 |
| 2020 | $9,983 | $960,800 | $663,900 | $296,900 |
| 2019 | $9,793 | $911,800 | $626,000 | $285,800 |
| 2018 | $9,421 | $854,900 | $569,100 | $285,800 |
| 2017 | $9,203 | $835,900 | $550,100 | $285,800 |
| 2016 | $9,068 | $816,900 | $531,100 | $285,800 |
| 2015 | $8,421 | $760,000 | $474,200 | $285,800 |
| 2014 | $8,048 | $725,700 | $455,300 | $270,400 |
Source: Public Records
Map
Nearby Homes
- 33 W Shore Dr
- 4 Fairview Rd
- 126 Lafayette St
- 2 Naples Rd Unit 1
- 34 Lafayette St
- 1 Haley Rd
- 30 Haley Rd Unit 1
- 1 Shore Ave
- 197A W Shore Dr Unit A
- 282 Pleasant St
- 72 Village St
- 106 Broadway Unit 3
- 81 Loring Ave
- 3 Wisteria St Unit 2
- 12 Pickwick Rd
- 16 Pickwick Rd
- 11 Angenica Terrace
- 9 Glover St Unit 1
- 1 Knollwood Rd
- 145 Evans Road Extension
- 26 Pinecliff Dr
- 32 Pinecliff Dr
- 15 Driftwood Rd
- 27 Pinecliff Dr
- 11 Driftwood Rd
- 25 Pinecliff Dr
- 49 Pinecliff Dr
- 17 Driftwood Rd
- 22 Pinecliff Dr
- 34 Pinecliff Dr
- 33 Pinecliff Dr
- 9 Driftwood Rd
- 14 Driftwood Rd
- 18 Driftwood Rd
- 19 Driftwood Rd
- 47 Pinecliff Dr
- 12 Driftwood Rd
- 36 Pinecliff Dr
- 50 Pinecliff Dr
- --- Ocean Avenue--- Unit ROCKBOUND
Your Personal Tour Guide
Ask me questions while you tour the home.