Estimated Value: $492,210 - $607,000
2
Beds
2
Baths
1,098
Sq Ft
$501/Sq Ft
Est. Value
About This Home
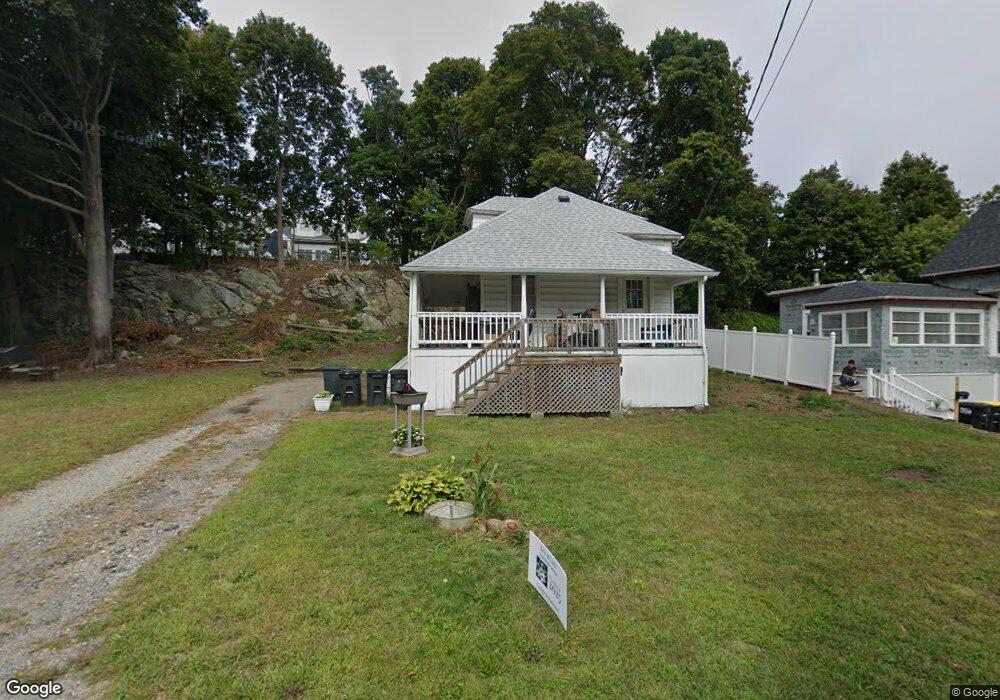
This home is located at 28 Pond St, Hull, MA 02045 and is currently estimated at $550,553, approximately $501 per square foot. 28 Pond St is a home located in Plymouth County with nearby schools including Lillian M. Jacobs Elementary School, Memorial Middle School, and Hull High School.
Ownership History
Date
Name
Owned For
Owner Type
Purchase Details
Closed on
Apr 19, 2018
Sold by
Minelli 4Th Ernest and Minelli Elizabeth K
Bought by
Minelli 4Th Ernest
Current Estimated Value
Purchase Details
Closed on
Dec 29, 1999
Sold by
Minelli Ernest
Bought by
Minelli Ernest
Create a Home Valuation Report for This Property
The Home Valuation Report is an in-depth analysis detailing your home's value as well as a comparison with similar homes in the area
Purchase History
| Date | Buyer | Sale Price | Title Company |
|---|---|---|---|
| Minelli 4Th Ernest | -- | -- | |
| Minelli Ernest | $128,000 | -- |
Source: Public Records
Mortgage History
| Date | Status | Borrower | Loan Amount |
|---|---|---|---|
| Previous Owner | Minelli Ernest | $243,200 | |
| Previous Owner | Minelli Ernest | $30,400 | |
| Previous Owner | Minelli Ernest | $221,000 | |
| Previous Owner | Minelli Ernest | $170,000 |
Source: Public Records
Tax History
| Year | Tax Paid | Tax Assessment Tax Assessment Total Assessment is a certain percentage of the fair market value that is determined by local assessors to be the total taxable value of land and additions on the property. | Land | Improvement |
|---|---|---|---|---|
| 2025 | $4,571 | $408,100 | $240,400 | $167,700 |
| 2024 | $4,532 | $389,000 | $232,100 | $156,900 |
| 2023 | $4,421 | $363,300 | $215,500 | $147,800 |
| 2022 | $4,255 | $339,300 | $198,900 | $140,400 |
| 2021 | $0 | $329,300 | $190,600 | $138,700 |
| 2020 | $3,977 | $323,200 | $190,600 | $132,600 |
| 2019 | $3,996 | $306,200 | $182,400 | $123,800 |
| 2018 | $3,645 | $291,200 | $182,400 | $108,800 |
| 2017 | $3,645 | $265,700 | $165,800 | $99,900 |
| 2016 | $3,582 | $265,700 | $165,800 | $99,900 |
| 2015 | $3,357 | $240,800 | $140,900 | $99,900 |
| 2014 | $3,255 | $234,700 | $140,900 | $93,800 |
Source: Public Records
Map
Nearby Homes
- 37 Richards Rd Unit A
- 37 Richards Rd
- 0 Seaview Ave
- 18 Valley Beach Ave
- 9 Meade Ave Unit 1
- 181 Atlantic Ave
- 6 Montana Ave
- 6 State Park Rd Unit 2
- 99 Nantasket Ave
- 1 Longbeach Ave Unit 202
- 62 Oceanside Dr
- 120 Nantasket Ave Unit 207
- 120 Nantasket Ave Unit 204
- 120 Nantasket Ave Unit 304
- 120 Nantasket Ave Unit PH5
- 120 Nantasket Ave Unit 201
- 121 Nantasket Ave Unit 503
- 30 Diab Ln Unit 8
- 23 Wyola Rd
- 10 Berkley Rd Unit A
Your Personal Tour Guide
Ask me questions while you tour the home.