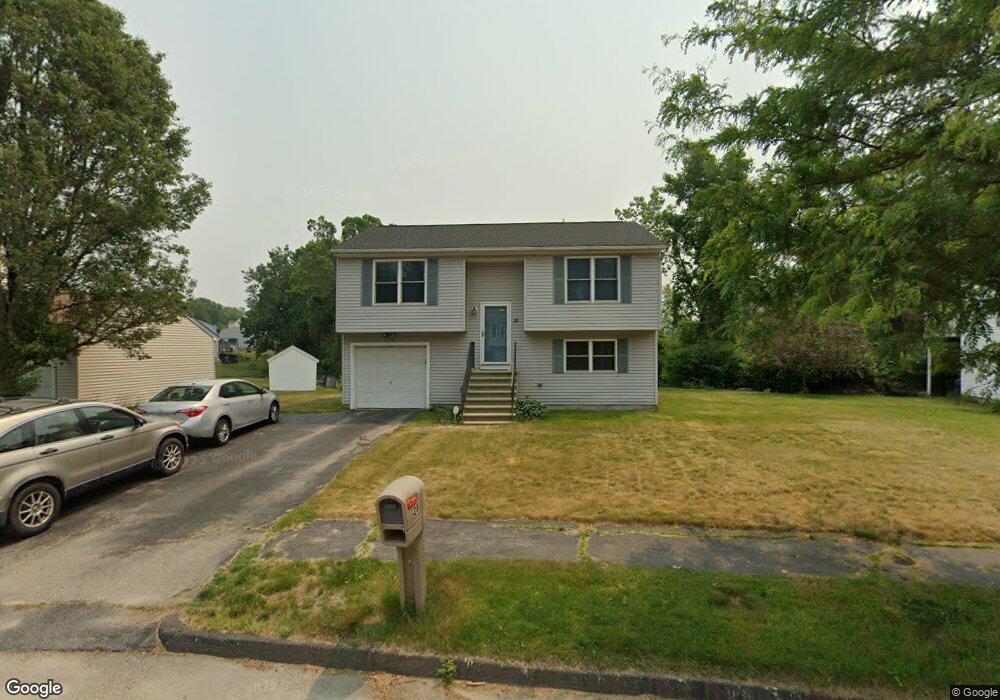
28 Travis St Worcester, MA 01604
Grafton Hill NeighborhoodEstimated Value: $423,000 - $521,000
3
Beds
2
Baths
1,000
Sq Ft
$454/Sq Ft
Est. Value
About This Home
This home is located at 28 Travis St, Worcester, MA 01604 and is currently estimated at $454,462, approximately $454 per square foot. 28 Travis St is a home located in Worcester County with nearby schools including Jacob Hiatt Magnet School, Chandler Magnet, and Rice Square Elementary School.
Ownership History
Date
Name
Owned For
Owner Type
Purchase Details
Closed on
Jul 28, 2022
Sold by
Aboagye Franklyn D and Aboagye Ruth A
Bought by
Aboagye Ft
Current Estimated Value
Purchase Details
Closed on
Aug 5, 1998
Sold by
Smallwood Vlg Assoc
Bought by
Aboagye Franklyn A and Aboagye Ruth A
Create a Home Valuation Report for This Property
The Home Valuation Report is an in-depth analysis detailing your home's value as well as a comparison with similar homes in the area
Home Values in the Area
Average Home Value in this Area
Purchase History
| Date | Buyer | Sale Price | Title Company |
|---|---|---|---|
| Aboagye Ft | -- | None Available | |
| Aboagye Franklyn A | $111,900 | -- |
Source: Public Records
Mortgage History
| Date | Status | Borrower | Loan Amount |
|---|---|---|---|
| Previous Owner | Aboagye Franklyn A | $70,000 | |
| Previous Owner | Aboagye Franklyn A | $30,000 | |
| Previous Owner | Aboagye Franklyn A | $135,000 |
Source: Public Records
Tax History
| Year | Tax Paid | Tax Assessment Tax Assessment Total Assessment is a certain percentage of the fair market value that is determined by local assessors to be the total taxable value of land and additions on the property. | Land | Improvement |
|---|---|---|---|---|
| 2025 | $5,440 | $412,400 | $118,600 | $293,800 |
| 2024 | $4,973 | $361,700 | $118,600 | $243,100 |
| 2023 | $4,916 | $342,800 | $103,100 | $239,700 |
| 2022 | $4,263 | $280,300 | $82,600 | $197,700 |
| 2021 | $4,072 | $250,100 | $66,100 | $184,000 |
| 2020 | $3,907 | $229,800 | $66,100 | $163,700 |
| 2019 | $3,807 | $211,500 | $59,500 | $152,000 |
| 2018 | $3,837 | $202,900 | $59,500 | $143,400 |
| 2017 | $3,665 | $190,700 | $59,500 | $131,200 |
| 2016 | $3,580 | $173,700 | $43,600 | $130,100 |
| 2015 | $3,486 | $173,700 | $43,600 | $130,100 |
| 2014 | $3,394 | $173,700 | $43,600 | $130,100 |
Source: Public Records
Map
Nearby Homes
- 83 Massasoit Rd
- 143 Dorcester
- 62 Allston Ave
- 130 Kenberma Rd
- 80 Delmont Ave
- 128 Derby St
- 61 Cohasset St
- 56 Cohasset St
- 155 Hamilton St Unit 3
- 143 Commonwealth Ave
- 25 Stoneham Rd
- 429 Grafton St Unit 2
- 256 Massasoit Rd
- 259 Massasoit Rd
- 81 Pilgrim Ave
- 103 Heywood St
- 56 Plantation St
- 16 Vincent Cir
- 266 Massasoit Rd
- 10 Almont Ave
- 26 Travis St
- 21 Arborwood Dr
- 24 Travis St
- 29 Travis St
- 27 Travis St
- 31 Travis St
- 15 Arborwood Dr
- 22 Arborwood Dr
- 20 Arborwood Dr
- 22 Travis St
- 18 Arborwood Dr
- 25 Travis St
- 24 Arborwood Dr
- 24 Arborwood Dr
- 183 Warner Ave
- 183 Warner Ave Unit 1
- 181 Warner Ave
- 15 Inverness Ave
- 11 Arborwood Dr
- 14 Arborwood Dr
Your Personal Tour Guide
Ask me questions while you tour the home.