Estimated Value: $415,000 - $476,908
About This Home
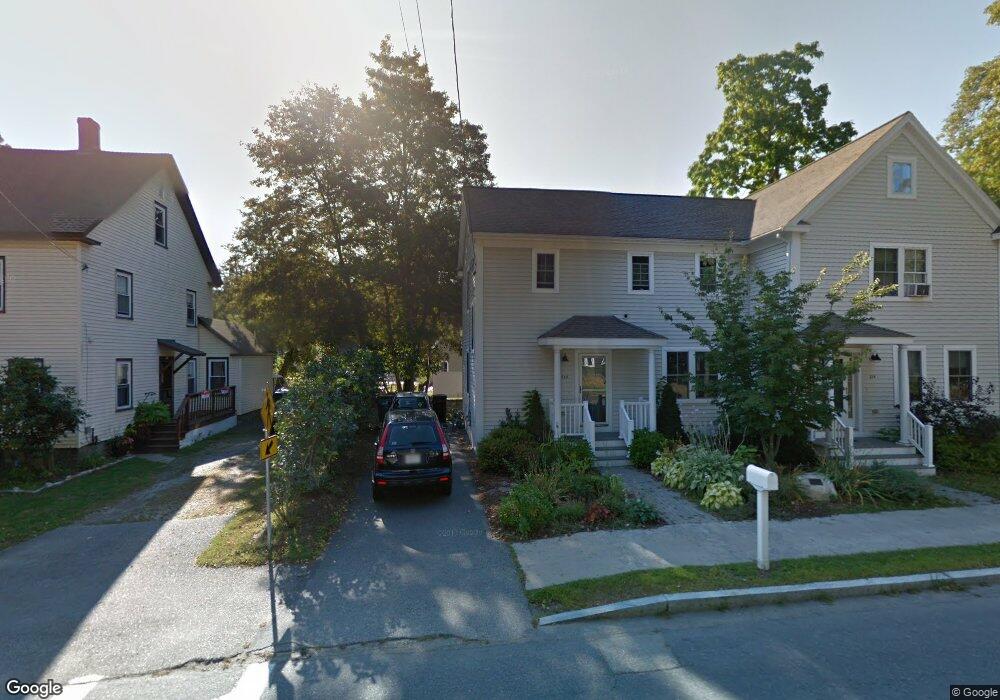
This home is located at 28 Willow St, Acton, MA 01720 and is currently estimated at $449,977, approximately $270 per square foot. 28 Willow St is a home located in Middlesex County with nearby schools including Acton-Boxborough Regional High School.
Ownership History
We collect this data history from publicly available records. To have your information removed, we recommend requesting removal directly through your county’s website.
Purchase Details
Home Financials for this Owner
Home Financials are based on the most recent Mortgage that was taken out on this home.Purchase Details
Home Values in the Area
Average Home Value in this Area
Purchase History
We collect this data history from publicly available records. To have your information removed, we recommend requesting removal directly through your county’s website.
| Date | Buyer | Sale Price | Title Company |
|---|---|---|---|
| $176,500 | -- | ||
| -- | -- |
Mortgage History
We collect this data history from publicly available records. To have your information removed, we recommend requesting removal directly through your county’s website.
| Date | Status | Borrower | Loan Amount |
|---|---|---|---|
| Open | $129,727 |
Tax History
We collect this data history from publicly available records. To have your information removed, we recommend requesting removal directly through your county’s website.
| Year | Tax Paid | Tax Assessment Tax Assessment Total Assessment is a certain percentage of the fair market value that is determined by local assessors to be the total taxable value of land and additions on the property. | Land | Improvement |
|---|---|---|---|---|
| 2025 | $4,925 | $287,200 | $0 | $287,200 |
| 2024 | $4,761 | $285,600 | $0 | $285,600 |
| 2023 | $4,488 | $255,600 | $0 | $255,600 |
| 2022 | $4,971 | $255,600 | $0 | $255,600 |
| 2021 | $4,744 | $234,500 | $0 | $234,500 |
| 2020 | $3,904 | $202,900 | $0 | $202,900 |
| 2019 | $3,857 | $199,100 | $0 | $199,100 |
| 2018 | $4,471 | $230,700 | $0 | $230,700 |
| 2017 | $4,134 | $216,900 | $0 | $216,900 |
| 2016 | $3,563 | $185,300 | $0 | $185,300 |
| 2015 | $3,202 | $168,100 | $0 | $168,100 |
| 2014 | $3,196 | $164,300 | $0 | $164,300 |
Map
- 92 Willow St Unit 1
- 2 Winter St
- 23 Spruce St Unit B
- 139 Willow St
- 31 Elm St
- 5 Elm St Unit 1
- 9 Deacon Hunt Dr
- 159 Prospect St Unit 4
- 35 Quaboag Rd
- 30 Duggan Rd
- 78 Macintosh Ln
- 104 Summer Rd
- 117 Summer Rd
- 20 Pine Pasture Run
- 15 Central St
- 39 Ethan Allen Dr
- 12 Kennedy Ln
- 17 Orchard Dr
- 67 Seminole Rd
- 40 Bicentenial Way
Ask me questions while you tour the home.