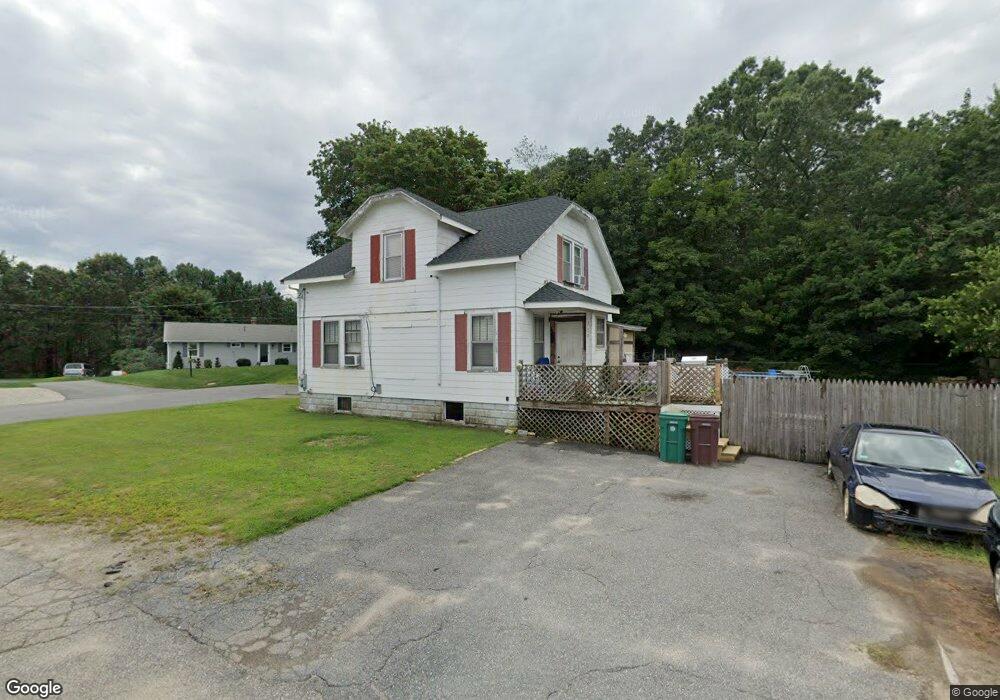
280 Dunlap St Woonsocket, RI 02895
East Woonsocket NeighborhoodEstimated Value: $354,472 - $431,000
3
Beds
1
Bath
2,512
Sq Ft
$158/Sq Ft
Est. Value
About This Home
This home is located at 280 Dunlap St, Woonsocket, RI 02895 and is currently estimated at $396,868, approximately $157 per square foot. 280 Dunlap St is a home located in Providence County with nearby schools including Woonsocket High School, Rise Prep Mayoral Academy Middle School, and Rise Prep Mayoral Academy.
Ownership History
Date
Name
Owned For
Owner Type
Purchase Details
Closed on
Oct 4, 2004
Sold by
Hart Richard J and Hart Cynthia E
Bought by
Ferreira Nuno P
Current Estimated Value
Home Financials for this Owner
Home Financials are based on the most recent Mortgage that was taken out on this home.
Original Mortgage
$206,755
Outstanding Balance
$99,048
Interest Rate
5.81%
Mortgage Type
Purchase Money Mortgage
Estimated Equity
$297,820
Create a Home Valuation Report for This Property
The Home Valuation Report is an in-depth analysis detailing your home's value as well as a comparison with similar homes in the area
Home Values in the Area
Average Home Value in this Area
Purchase History
| Date | Buyer | Sale Price | Title Company |
|---|---|---|---|
| Ferreira Nuno P | $210,000 | -- | |
| Ferreira Nuno P | $210,000 | -- |
Source: Public Records
Mortgage History
| Date | Status | Borrower | Loan Amount |
|---|---|---|---|
| Open | Ferreira Nuno P | $19,500 | |
| Open | Ferreira Nuno P | $206,755 | |
| Closed | Ferreira Nuno P | $206,755 | |
| Previous Owner | Ferreira Nuno P | $75,000 |
Source: Public Records
Tax History
| Year | Tax Paid | Tax Assessment Tax Assessment Total Assessment is a certain percentage of the fair market value that is determined by local assessors to be the total taxable value of land and additions on the property. | Land | Improvement |
|---|---|---|---|---|
| 2025 | $3,283 | $292,300 | $108,100 | $184,200 |
| 2024 | $3,128 | $215,100 | $88,200 | $126,900 |
| 2023 | $3,007 | $215,100 | $88,200 | $126,900 |
| 2022 | $3,007 | $215,100 | $88,200 | $126,900 |
| 2021 | $3,325 | $140,000 | $70,800 | $69,200 |
| 2020 | $3,360 | $140,000 | $70,800 | $69,200 |
| 2018 | $3,371 | $140,000 | $70,800 | $69,200 |
| 2017 | $3,919 | $130,200 | $65,400 | $64,800 |
| 2016 | $4,146 | $130,200 | $65,400 | $64,800 |
| 2015 | $4,763 | $130,200 | $65,400 | $64,800 |
| 2014 | $4,723 | $131,400 | $72,100 | $59,300 |
Source: Public Records
Map
Nearby Homes
- 7 Theresa Marie Ave
- 727 Mendon Rd
- 1088 Diamond Hill Rd
- 202 Paine St
- 79 Saint Agnes Ave
- 89 Saint Agnes Ave
- 212 Saint Louis Ave
- 188 Saint Louis Ave
- 33 Achille St
- 178 Saint Louis Ave
- 194 Paine St
- 213 St Louis Ave
- 255 Knollwood Dr
- 68 Kenwood St
- 568 Elm St
- 366 Aylsworth Ave
- 551 Wood Ave
- 538 Wood Ave
- Lot 2 Pulaski Blvd
- 21 Irving St
Your Personal Tour Guide
Ask me questions while you tour the home.