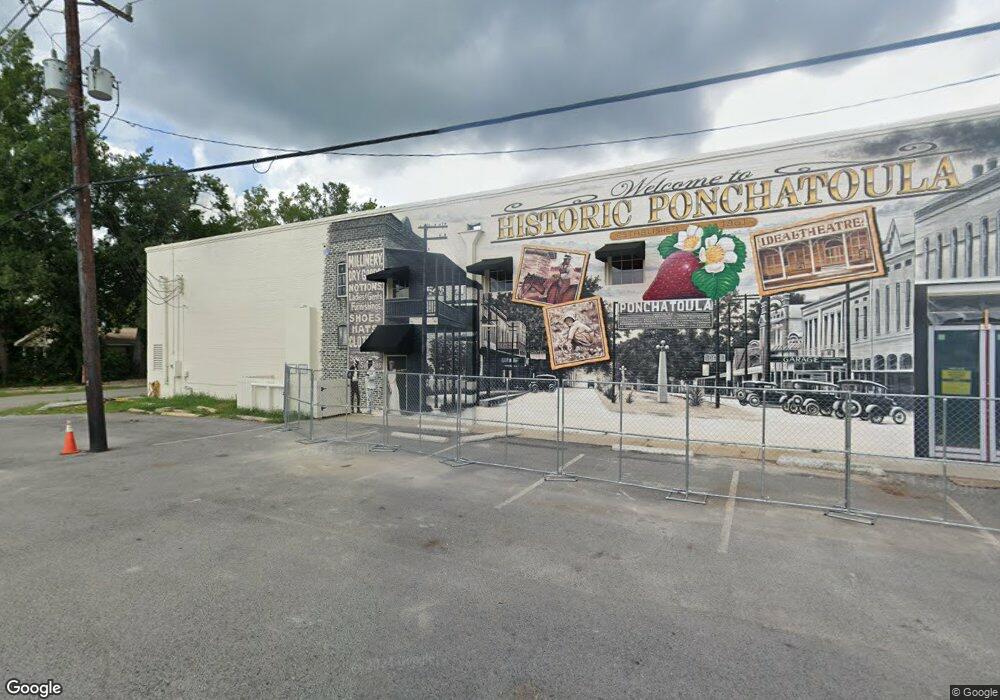
280 W Pine St Unit B Ponchatoula, LA 70454
Estimated Value: $661,320
Studio
--
Bath
2,000
Sq Ft
$331/Sq Ft
Est. Value
About This Home
This home is located at 280 W Pine St Unit B, Ponchatoula, LA 70454 and is currently estimated at $661,320, approximately $330 per square foot. 280 W Pine St Unit B is a home located in Tangipahoa Parish with nearby schools including Perrin Early Learning Center, Tucker Memorial Elementary School, and D.C. Reeves Elementary School.
Ownership History
Date
Name
Owned For
Owner Type
Purchase Details
Closed on
Jul 9, 2025
Sold by
Ryder & Ryder Ltd
Bought by
Jg 18
Current Estimated Value
Purchase Details
Closed on
Jun 1, 2023
Sold by
Uncle Bens Seafood Llc
Bought by
Ryder & Ryder Ltd
Home Financials for this Owner
Home Financials are based on the most recent Mortgage that was taken out on this home.
Original Mortgage
$491,250
Outstanding Balance
$478,556
Interest Rate
6.79%
Estimated Equity
$182,764
Purchase Details
Closed on
Nov 30, 2021
Sold by
Dream Away Llc
Bought by
Uncle Bens Seafood Llc
Purchase Details
Closed on
Apr 2, 2019
Sold by
Gemma Holdings Llc
Bought by
Dream Away Llc
Home Financials for this Owner
Home Financials are based on the most recent Mortgage that was taken out on this home.
Original Mortgage
$465,000
Interest Rate
4.3%
Mortgage Type
Purchase Money Mortgage
Purchase Details
Closed on
Jun 7, 2005
Sold by
Himel Auto Parts Of Ponchatoula Inc
Bought by
Gemma Holdings Llc
Home Financials for this Owner
Home Financials are based on the most recent Mortgage that was taken out on this home.
Original Mortgage
$285,000
Interest Rate
5.76%
Mortgage Type
Future Advance Clause Open End Mortgage
Create a Home Valuation Report for This Property
The Home Valuation Report is an in-depth analysis detailing your home's value as well as a comparison with similar homes in the area
Home Values in the Area
Average Home Value in this Area
Purchase History
| Date | Buyer | Sale Price | Title Company |
|---|---|---|---|
| Jg 18 | -- | -- | |
| Jg 18 | -- | -- | |
| Ryder & Ryder Ltd | $655,000 | Crescent Title | |
| Uncle Bens Seafood Llc | $533,091 | None Listed On Document | |
| Uncle Bens Seafood Llc | $533,091 | None Listed On Document | |
| Dream Away Llc | $565,000 | -- | |
| Gemma Holdings Llc | $285,000 | None Available |
Source: Public Records
Mortgage History
| Date | Status | Borrower | Loan Amount |
|---|---|---|---|
| Open | Ryder & Ryder Ltd | $491,250 | |
| Previous Owner | Dream Away Llc | $465,000 | |
| Previous Owner | Gemma Holdings Llc | $285,000 |
Source: Public Records
Tax History
| Year | Tax Paid | Tax Assessment Tax Assessment Total Assessment is a certain percentage of the fair market value that is determined by local assessors to be the total taxable value of land and additions on the property. | Land | Improvement |
|---|---|---|---|---|
| 2025 | $6,039 | $87,286 | $0 | $87,286 |
| 2024 | $2,238 | $32,832 | $0 | $32,832 |
| 2023 | $2,244 | $32,256 | $0 | $32,256 |
| 2022 | $3,747 | $53,856 | $0 | $53,856 |
| 2021 | $4,638 | $53,856 | $0 | $53,856 |
| 2020 | $4,632 | $53,856 | $0 | $53,856 |
| 2019 | $4,620 | $46,656 | $0 | $46,656 |
| 2018 | $4,636 | $53,856 | $7,200 | $46,656 |
| 2017 | $4,635 | $53,856 | $7,200 | $46,656 |
| 2016 | $2,768 | $32,166 | $9,000 | $23,166 |
| 2015 | $2,240 | $32,166 | $9,000 | $23,166 |
| 2014 | $2,047 | $32,166 | $9,000 | $23,166 |
Source: Public Records
Map
Nearby Homes
- 280 W Pine St
- 160 N 7th St
- 162 N 7th St
- 170 N 7th St
- 207 W Pine St Unit A-8
- 207 W Pine St Unit A-7
- 207 W Pine St Unit A-6
- 207 W Pine St Unit A-5
- 207 W Pine St Unit A-4
- 207 W Pine St Unit A-3
- 207 W Pine St Unit A-2
- 207 W Pine St Unit A-1
- 207 W Pine St Unit B
- 207 W Pine St
- 230 W Pine St
- 131 N 7th St
- 111 N 6th St
- 265 W Hickory St
- 208 W Pine St
- 141 N 7th St
Your Personal Tour Guide
Ask me questions while you tour the home.