2811 Ross Rd Durham, NC 27703
Eastern Durham NeighborhoodEstimated Value: $195,000 - $281,000
About This Home
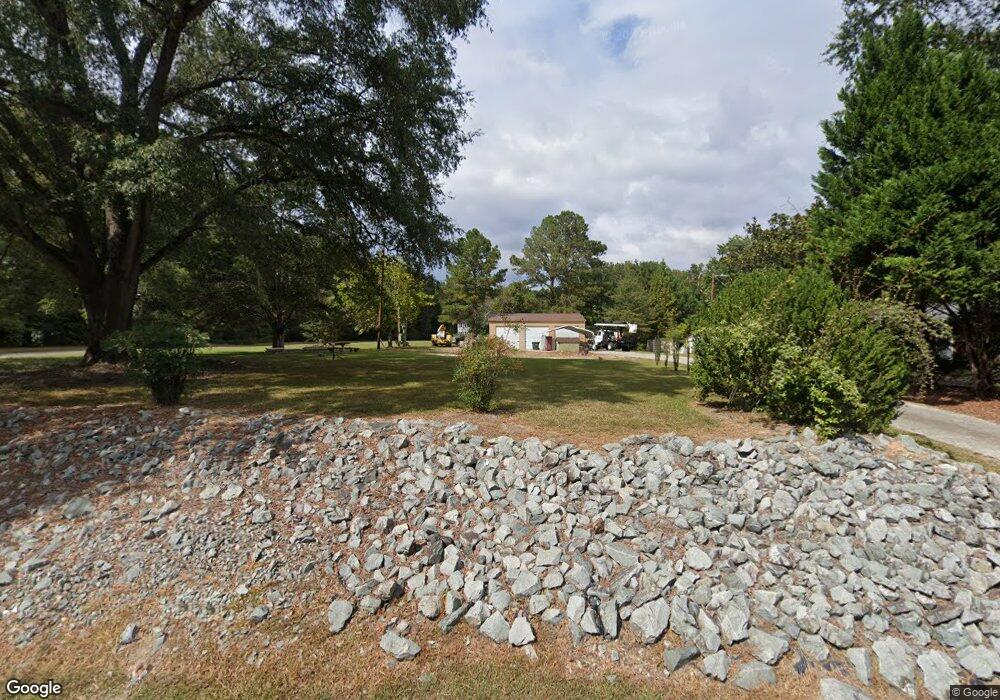
This home is located at 2811 Ross Rd, Durham, NC 27703 and is currently estimated at $236,485, approximately $243 per square foot. 2811 Ross Rd is a home located in Durham County with nearby schools including Oak Grove Elementary, John W Neal Middle School, and Southern School of Energy & Sustainability.
Ownership History
We collect this data history from publicly available records. To have your information removed, we recommend requesting removal directly through your county’s website.
Purchase Details
Home Financials for this Owner
Home Financials are based on the most recent Mortgage that was taken out on this home.Home Values in the Area
Average Home Value in this Area
Purchase History
We collect this data history from publicly available records. To have your information removed, we recommend requesting removal directly through your county’s website.
| Date | Buyer | Sale Price | Title Company |
|---|---|---|---|
| -- | None Listed On Document |
Mortgage History
We collect this data history from publicly available records. To have your information removed, we recommend requesting removal directly through your county’s website.
| Date | Status | Borrower | Loan Amount |
|---|---|---|---|
| Open | $2,011,872 |
Tax History
We collect this data history from publicly available records. To have your information removed, we recommend requesting removal directly through your county’s website.
| Year | Tax Paid | Tax Assessment Tax Assessment Total Assessment is a certain percentage of the fair market value that is determined by local assessors to be the total taxable value of land and additions on the property. | Land | Improvement |
|---|---|---|---|---|
| 2025 | $2,141 | $216,016 | $127,400 | $88,616 |
| 2024 | $1,627 | $116,663 | $44,010 | $72,653 |
| 2023 | $35 | $116,663 | $44,010 | $72,653 |
| 2022 | $1,493 | $116,663 | $44,010 | $72,653 |
| 2021 | $1,486 | $116,663 | $44,010 | $72,653 |
| 2020 | $1,451 | $116,663 | $44,010 | $72,653 |
| 2019 | $1,451 | $116,663 | $44,010 | $72,653 |
| 2018 | $1,288 | $94,925 | $29,340 | $65,585 |
| 2017 | $1,278 | $94,925 | $29,340 | $65,585 |
| 2016 | $1,235 | $94,925 | $29,340 | $65,585 |
| 2015 | $1,395 | $100,792 | $33,406 | $67,386 |
| 2014 | $1,395 | $100,792 | $33,406 | $67,386 |
Map
- 3104 Brellon Ln
- 2112 Terrawood Dr
- 110 N Woodcrest St
- 5 Jenee Ln
- 217 Fountain St
- 209 Fountain St
- 2102 Enrichment Way
- 3013 Worthy Way
- 2923 Wedgedale Ave
- 3013 Wedgedale Ave
- 2808 Lutz Ln Unit 3
- 2513 Rochelle St
- 114 Cushman St
- 2750 Holloway St
- 222 Ruby Ridge Rd
- 607 Chandler Rd
- 2616 Wedgedale Ave
- 7 Mercury Ct
- 204 Cushman St
- 2011 Seford Dr
- 2813 Ross Rd
- 2815 Ross Rd
- 2817 Ross Rd
- 2806 Ross Rd
- 2821 Ross Rd
- 2801 Ross Rd
- 404 Belmont Dr
- 2804 Ross Rd
- 408 Belmont Dr
- 413 Princess Ann Dr
- 2807 Ross Rd
- 411 Princess Anne Dr
- 2802 Ross Rd
- 2823 Ross Rd
- 410 Belmont Dr
- 415 Princess Ann Dr
- 2800 Ross Rd
- 415 Princess Anne Dr
- 412 Belmont Dr
- 419 Princess Ann Dr
Ask me questions while you tour the home.