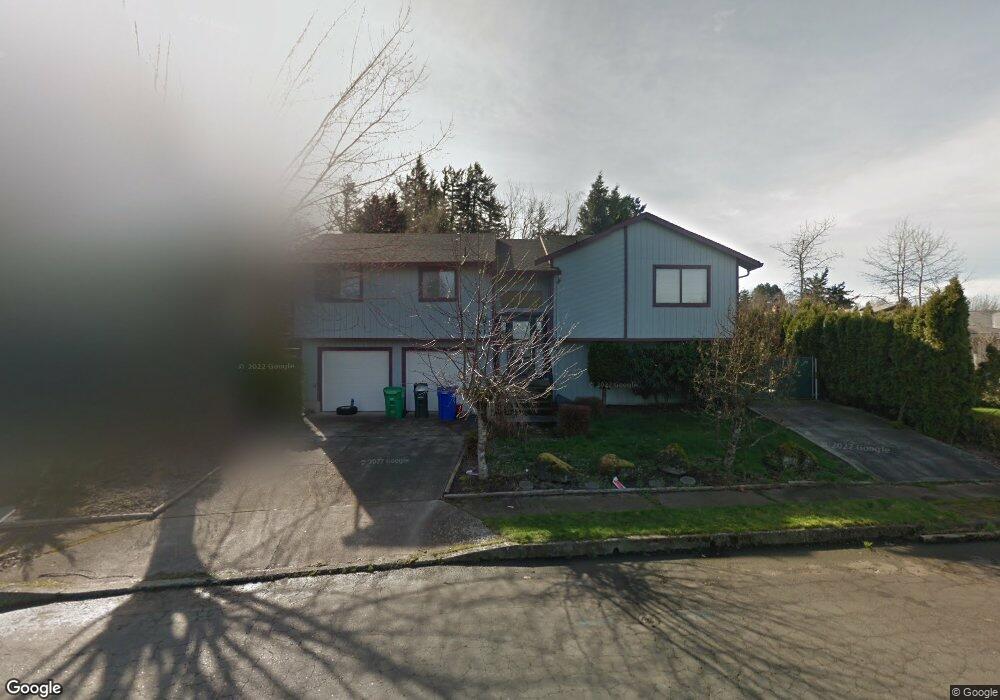
2816 NE 7th Ct Gresham, OR 97030
Powell Valley NeighborhoodEstimated Value: $471,000 - $518,000
4
Beds
3
Baths
2,488
Sq Ft
$200/Sq Ft
Est. Value
About This Home
This home is located at 2816 NE 7th Ct, Gresham, OR 97030 and is currently estimated at $496,420, approximately $199 per square foot. 2816 NE 7th Ct is a home located in Multnomah County with nearby schools including Hall Elementary School, Gordon Russell Middle School, and Sam Barlow High School.
Ownership History
Date
Name
Owned For
Owner Type
Purchase Details
Closed on
Nov 21, 2020
Sold by
Rhodes Brian A and Rhodes Leticia F
Bought by
Rhodes Leticia F
Current Estimated Value
Home Financials for this Owner
Home Financials are based on the most recent Mortgage that was taken out on this home.
Original Mortgage
$191,300
Outstanding Balance
$170,151
Interest Rate
2.9%
Mortgage Type
New Conventional
Estimated Equity
$326,269
Purchase Details
Closed on
Jun 29, 2011
Sold by
Olson Jeffrey A
Bought by
Rhodes Brian A and Rhodes Leticia F
Home Financials for this Owner
Home Financials are based on the most recent Mortgage that was taken out on this home.
Original Mortgage
$167,639
Interest Rate
4.55%
Mortgage Type
FHA
Purchase Details
Closed on
Jul 14, 2005
Sold by
Watson Gerald W
Bought by
Olson Jeffrey A and Miller Pamela L
Home Financials for this Owner
Home Financials are based on the most recent Mortgage that was taken out on this home.
Original Mortgage
$174,000
Interest Rate
5.56%
Mortgage Type
Fannie Mae Freddie Mac
Create a Home Valuation Report for This Property
The Home Valuation Report is an in-depth analysis detailing your home's value as well as a comparison with similar homes in the area
Home Values in the Area
Average Home Value in this Area
Purchase History
| Date | Buyer | Sale Price | Title Company |
|---|---|---|---|
| Rhodes Leticia F | -- | Amrock Llc | |
| Rhodes Brian A | $180,000 | Wfg Title | |
| Olson Jeffrey A | $217,500 | Chicago Title Insurance Comp |
Source: Public Records
Mortgage History
| Date | Status | Borrower | Loan Amount |
|---|---|---|---|
| Open | Rhodes Leticia F | $191,300 | |
| Closed | Rhodes Brian A | $167,639 | |
| Previous Owner | Olson Jeffrey A | $174,000 |
Source: Public Records
Tax History
| Year | Tax Paid | Tax Assessment Tax Assessment Total Assessment is a certain percentage of the fair market value that is determined by local assessors to be the total taxable value of land and additions on the property. | Land | Improvement |
|---|---|---|---|---|
| 2025 | $4,991 | $245,250 | -- | -- |
| 2024 | $4,777 | $238,110 | -- | -- |
| 2023 | $4,353 | $231,180 | $0 | $0 |
| 2022 | $4,231 | $224,450 | $0 | $0 |
| 2021 | $4,124 | $217,920 | $0 | $0 |
| 2020 | $3,881 | $211,580 | $0 | $0 |
| 2019 | $3,779 | $205,420 | $0 | $0 |
| 2018 | $3,603 | $199,440 | $0 | $0 |
| 2017 | $3,457 | $193,640 | $0 | $0 |
| 2016 | $3,048 | $188,000 | $0 | $0 |
Source: Public Records
Map
Nearby Homes
- 2811 NE 6th St
- 2632 NE 7th Ct
- 445 NE Village Squire Ave Unit 4
- 820 NE Cochran Ave
- 579 NE Fleming Ave Unit C41
- 2980 NE Division St Unit 31
- 2980 NE Division St Unit 13
- 2980 NE Division St Unit 43
- 361 NE Village Squire Ave Unit 4
- 251 NE Village Squire Ave Unit 2
- 251 NE Village Squire Ave Unit 15
- 0 SE 1st St
- 3454 NE 5th Ct
- 900 NE Francis Ave Unit 29
- 900 NE Francis Ave
- 900 NE Francis Ave Unit 63
- 1350 NE Cochran Dr
- 1275 NE Country Club Ave
- 180 NE Kane Dr Unit 180
- 2941 NE 13th St Unit 22
- 2782 NE 7th Ct
- 2832 NE 7th Ct
- 2835 NE 6th St
- 2766 NE 7th Ct
- 2803 NE 6th St
- 2787 NE 7th Ct
- 2860 NE 7th St
- 2857 NE 6th St
- 720 NE Village Squire Ave
- 2753 NE 7th Ct
- 2742 NE 7th Ct
- 2855 NE 7th St
- 731 NE V
- 2881 NE 6th St
- 731 NE Village Squire Ave
- 2886 NE 7th St
- 740 NE Village Squire Ave
- 2717 NE 6th St
- 2864 NE 6th St
- 2737 NE 7th Ct
Your Personal Tour Guide
Ask me questions while you tour the home.