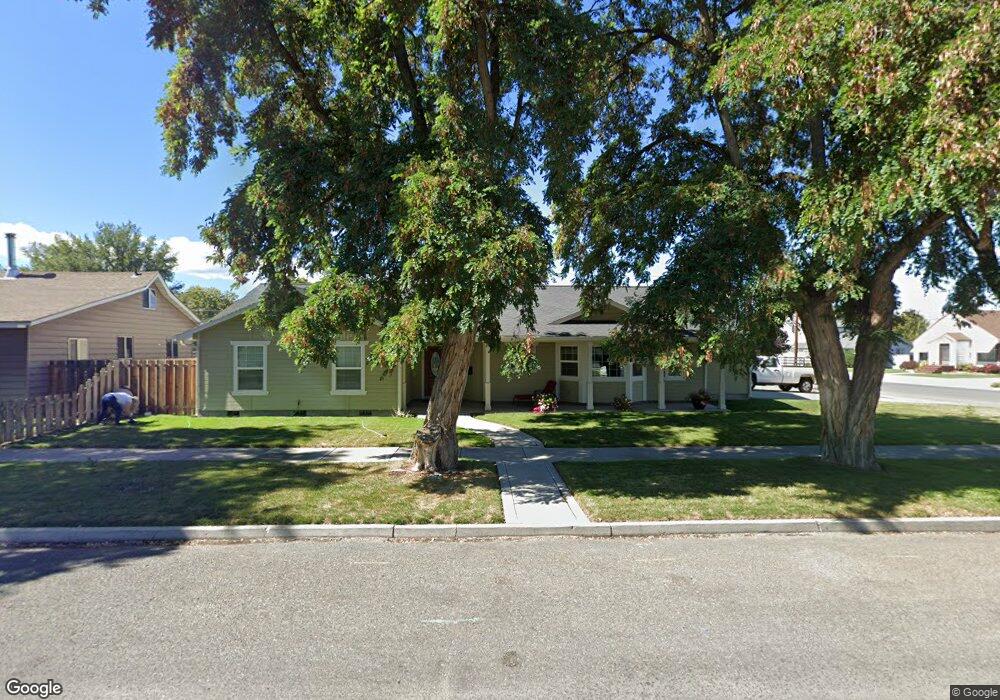
2839 3rd St Baker City, OR 97814
Estimated Value: $360,000 - $419,000
3
Beds
2
Baths
1,575
Sq Ft
$249/Sq Ft
Est. Value
About This Home
This home is located at 2839 3rd St, Baker City, OR 97814 and is currently estimated at $392,239, approximately $249 per square foot. 2839 3rd St is a home located in Baker County with nearby schools including Brooklyn Primary School, Baker Middle School, and Baker High School.
Ownership History
Date
Name
Owned For
Owner Type
Purchase Details
Closed on
Oct 26, 2022
Sold by
Gwynn James I and Gwynn Rebecca A
Bought by
Crain Larry O and Crain Jeanne A
Current Estimated Value
Purchase Details
Closed on
Apr 30, 2021
Sold by
Day Jean C Living Trust
Bought by
Gwynn James I
Home Financials for this Owner
Home Financials are based on the most recent Mortgage that was taken out on this home.
Original Mortgage
$315,000
Interest Rate
2.96%
Mortgage Type
VA
Create a Home Valuation Report for This Property
The Home Valuation Report is an in-depth analysis detailing your home's value as well as a comparison with similar homes in the area
Purchase History
| Date | Buyer | Sale Price | Title Company |
|---|---|---|---|
| Crain Larry O | $365,000 | Amerititle | |
| Gwynn James I | $315,000 | Amerititle |
Source: Public Records
Mortgage History
| Date | Status | Borrower | Loan Amount |
|---|---|---|---|
| Previous Owner | Gwynn James I | $315,000 |
Source: Public Records
Tax History
| Year | Tax Paid | Tax Assessment Tax Assessment Total Assessment is a certain percentage of the fair market value that is determined by local assessors to be the total taxable value of land and additions on the property. | Land | Improvement |
|---|---|---|---|---|
| 2025 | $3,878 | $218,606 | $33,690 | $184,916 |
| 2024 | $3,759 | $212,239 | $29,629 | $182,610 |
| 2023 | $3,688 | $206,058 | $29,032 | $177,026 |
| 2022 | $3,068 | $200,057 | $32,479 | $167,578 |
| 2021 | $2,974 | $194,231 | $34,709 | $159,522 |
| 2020 | $3,156 | $188,574 | $35,682 | $152,892 |
| 2019 | $2,960 | $183,082 | $29,760 | $153,322 |
Source: Public Records
Map
Nearby Homes
Your Personal Tour Guide
Ask me questions while you tour the home.