Estimated Value: $337,000 - $365,000
1
Bed
1
Bath
960
Sq Ft
$362/Sq Ft
Est. Value
About This Home
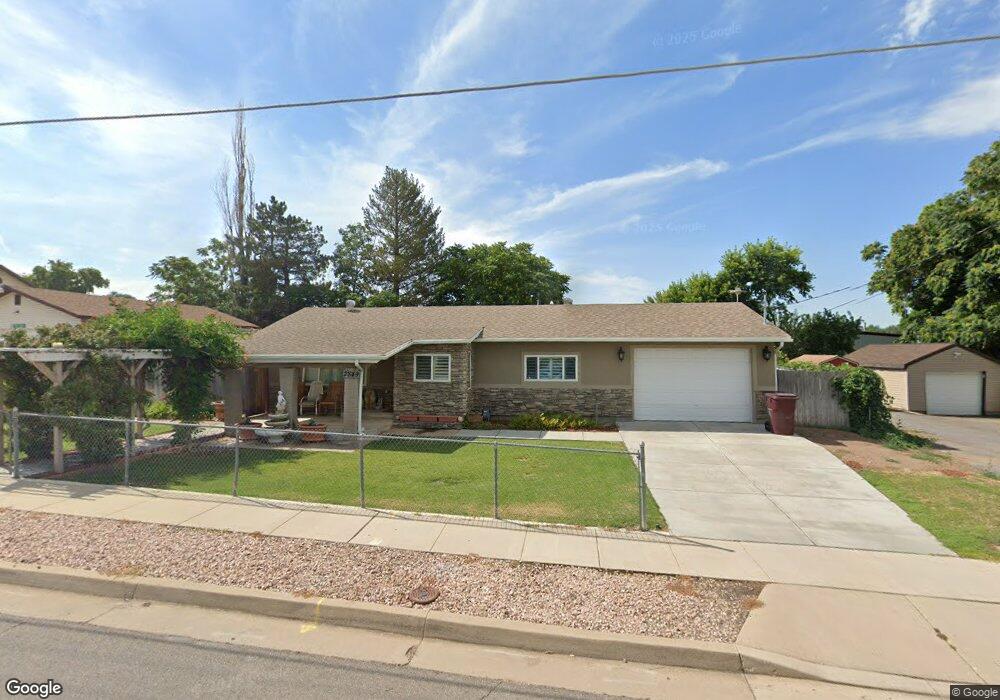
This home is located at 2849 W 4800 S, Roy, UT 84067 and is currently estimated at $347,712, approximately $362 per square foot. 2849 W 4800 S is a home located in Weber County with nearby schools including Midland School, Sand Ridge Junior High School, and Roy High School.
Ownership History
Date
Name
Owned For
Owner Type
Purchase Details
Closed on
Mar 2, 2012
Sold by
Miller Steven R
Bought by
Miller Steven R and The Steven R Miller Revocable Living Tru
Current Estimated Value
Purchase Details
Closed on
Apr 13, 2010
Sold by
Miller Bruce J and Miller Steven R
Bought by
Miller Steven R
Purchase Details
Closed on
Dec 15, 2009
Sold by
Miller Dorothy Janet
Bought by
Miller Bruce J
Create a Home Valuation Report for This Property
The Home Valuation Report is an in-depth analysis detailing your home's value as well as a comparison with similar homes in the area
Home Values in the Area
Average Home Value in this Area
Purchase History
We collect this data history from publicly available records. To have your information removed, we recommend requesting removal directly through your county’s website.
| Date | Buyer | Sale Price | Title Company |
|---|---|---|---|
| Miller Steven R | -- | None Available | |
| Miller Steven R | -- | None Available | |
| Miller Bruce J | -- | None Available |
Source: Public Records
Tax History
| Year | Tax Paid | Tax Assessment Tax Assessment Total Assessment is a certain percentage of the fair market value that is determined by local assessors to be the total taxable value of land and additions on the property. | Land | Improvement |
|---|---|---|---|---|
| 2025 | $2,145 | $306,185 | $114,959 | $191,226 |
| 2024 | $2,068 | $162,799 | $63,227 | $99,572 |
| 2023 | $1,961 | $153,450 | $57,082 | $96,368 |
| 2022 | $2,074 | $168,300 | $48,217 | $120,083 |
| 2021 | $1,670 | $218,000 | $65,724 | $152,276 |
| 2020 | $1,498 | $178,000 | $65,724 | $112,276 |
| 2019 | $1,398 | $156,000 | $39,911 | $116,089 |
| 2018 | $1,242 | $129,000 | $39,911 | $89,089 |
| 2017 | $1,261 | $126,000 | $39,911 | $86,089 |
| 2016 | $1,137 | $60,522 | $19,259 | $41,263 |
| 2015 | $1,027 | $55,488 | $19,259 | $36,229 |
| 2014 | $1,026 | $55,488 | $19,259 | $36,229 |
Source: Public Records
Map
Nearby Homes
- 2802 W 4875 S
- 4931 S 2825 W
- 2872 W 5000 S
- 5037 S 2875 W
- 3004 W 4650 S
- 4805 S 3100 W
- 283 3800 S 1900 W #283 Unit 283
- 229 3800 S 1900 W Unit 229
- 3080 W 4600 S
- 4848 S 3200 W
- 5202 S 2675 W
- 2402 W 5075 S
- 5249 S 2500 W
- 4371 S 2900 W
- 5301 S 2675 W
- 5331 S 2675 W
- 4510 Stone Creek Rd Unit F
- 2167 W 4950 S
- 4444 S Cross Creek Rd Unit B
- 3405 W 4525 S
Your Personal Tour Guide
Ask me questions while you tour the home.